The U.S. Treasury yield curve is the single most information-dense chart in markets. It is one line, and its shape tells you what investors expect from growth, inflation, and the Federal Reserve all at once. Most of the time it slopes gently upward. Occasionally it flattens. And every so often it inverts, which is the chart's way of flashing a recession warning that has preceded nearly every U.S. downturn in modern history. Here is how to read it.
What the yield curve actually is
A yield curve plots the interest rate, the yield, the government pays to borrow against how long it is borrowing for. The x-axis runs from one month out to thirty years; the y-axis is the yield at each maturity.
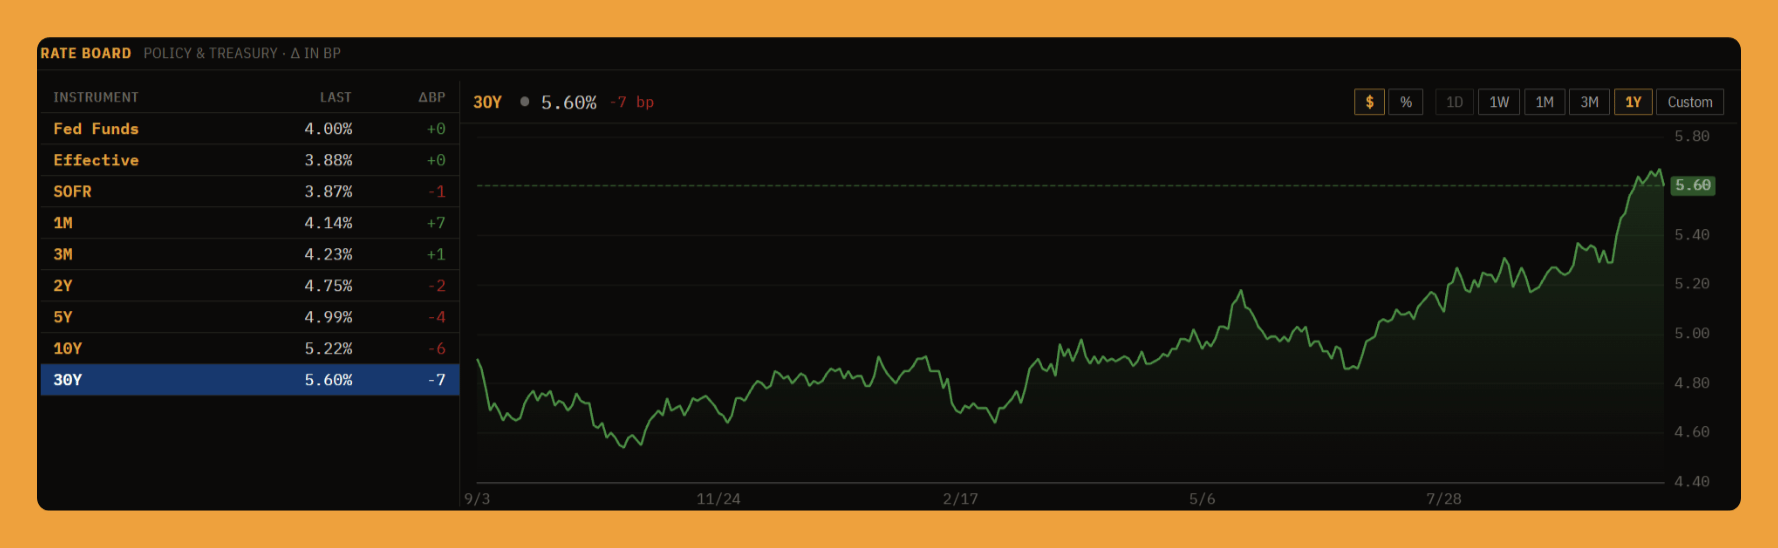
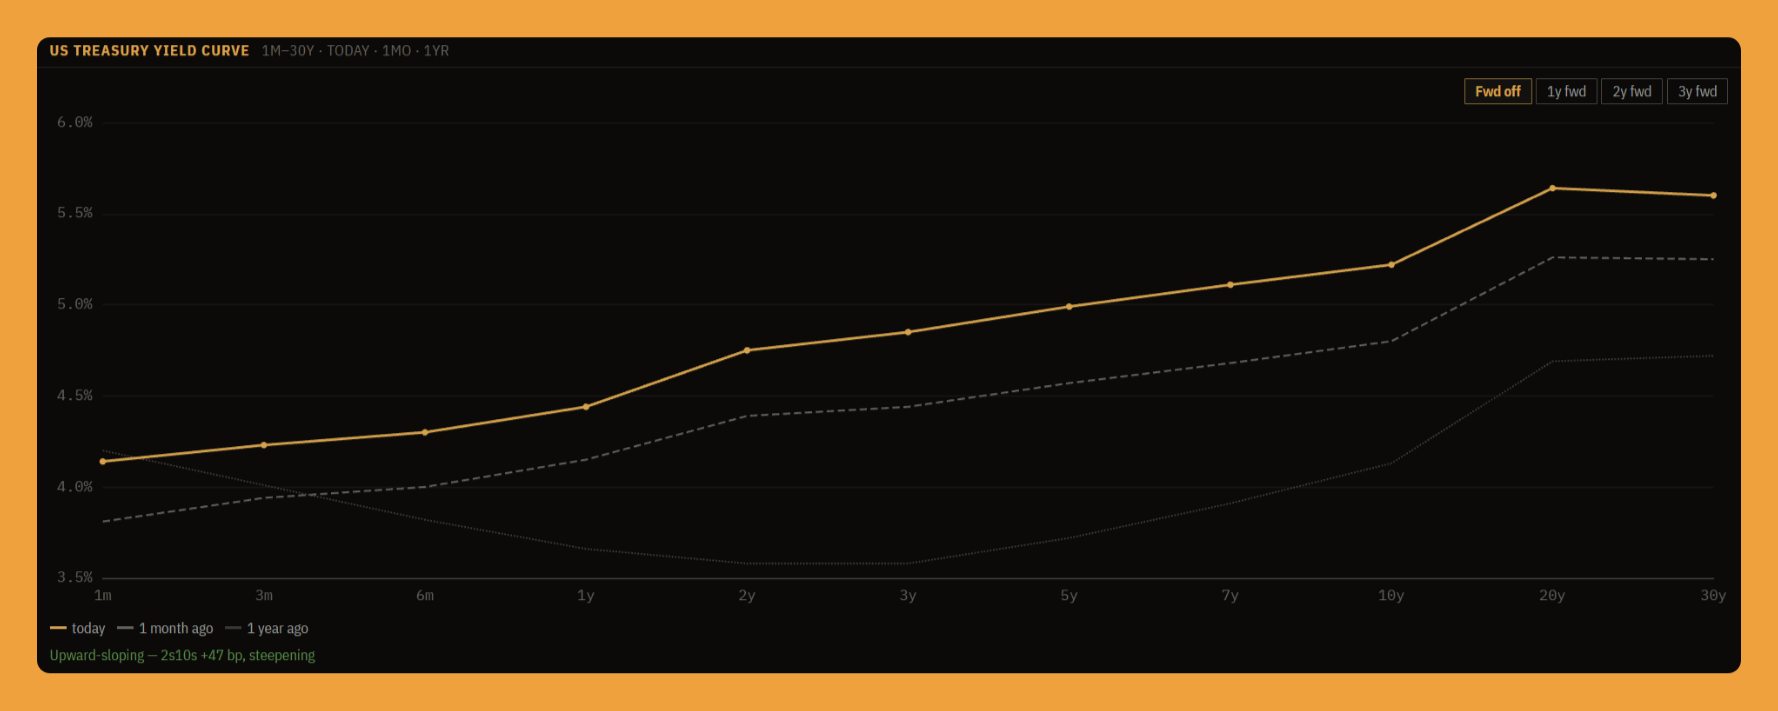
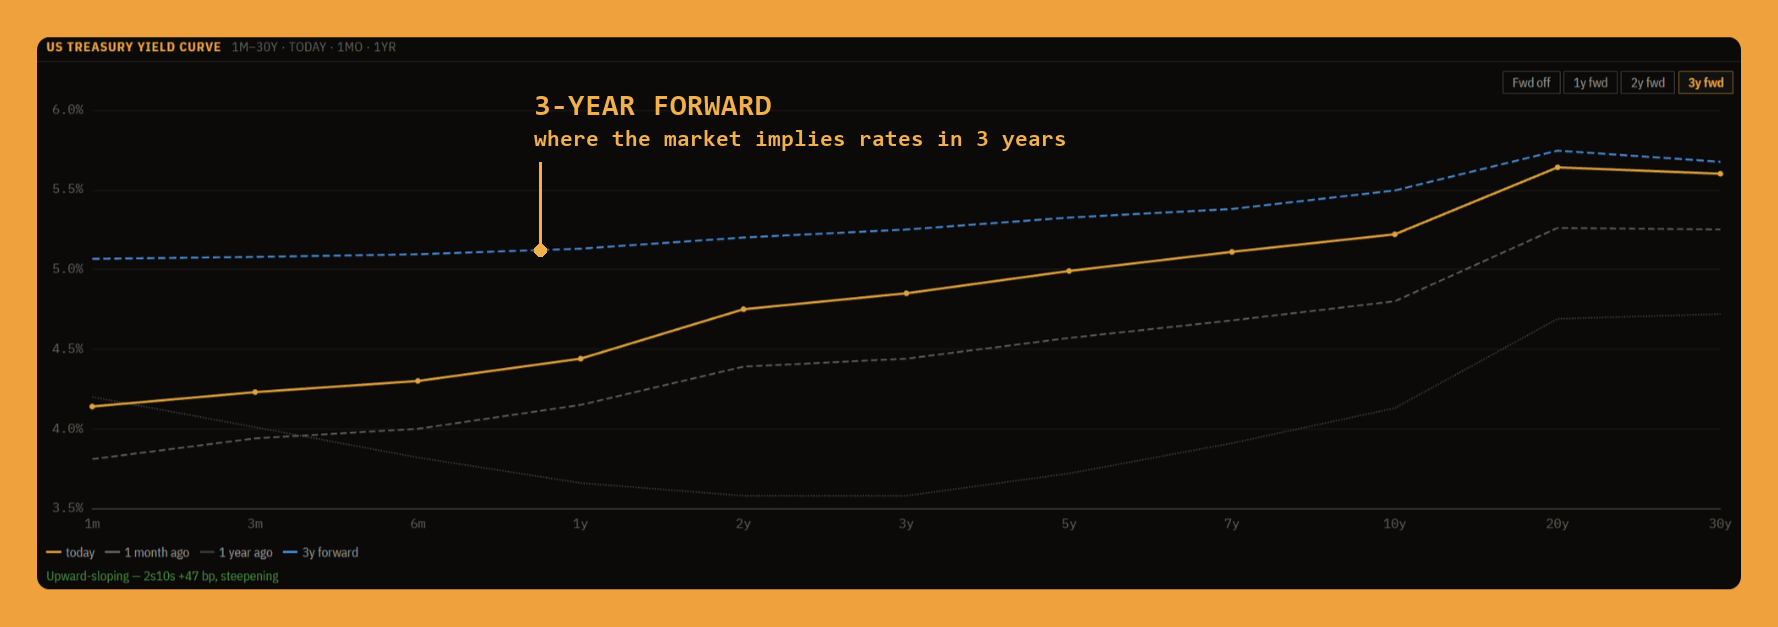
Right now the curve looks like this: one-month bills yield about 4.14%, the two-year note about 4.75%, the ten-year about 5.22%, and the thirty-year bond about 5.60%. Each point is a different Treasury maturity; connect them and you have the curve. The reason it is one chart instead of nine separate numbers is that the shape carries information the individual yields do not.
The three shapes: normal, flat, inverted
A normal, upward-sloping curve means longer loans pay more than shorter ones. You demand extra yield to lock your money up for thirty years instead of thirty days. This is the healthy, default state, and it is what we have today: yields climb steadily from the front end to the long end.
A flat curve is one where the gap between short and long has collapsed. The market is unsure, and this is often a transition state on the way into or out of inversion.
An inverted curve is the abnormal one: short-term yields rise above long-term ones and the curve tips downward. It typically happens when the Fed has pushed short rates high to fight inflation while the bond market, expecting those hikes to slow the economy and force future cuts, keeps long rates lower. An inverted curve is the market effectively betting on a slowdown.
The two spreads that define inversion: 2s10s and 3m10y
You do not eyeball the whole curve to check for inversion. You watch a spread, which is just one yield minus another.
The 2s10s is the ten-year yield minus the two-year, and it is the one most traders quote. Positive means normal; negative means inverted. Today it sits around positive 50 basis points, so it is not inverted. The 3m10y is the ten-year minus the three-month, and it is the spread the Fed's own researchers prefer as a recession gauge; today it is wider still. When either spread goes negative, the recession clock, historically, starts ticking.

Info: The 3m10y spread gets less airtime than the 2s10s, but it is the one the Fed's own research leans on as a recession indicator, worth watching both.
Why you compare today to a month and a year ago
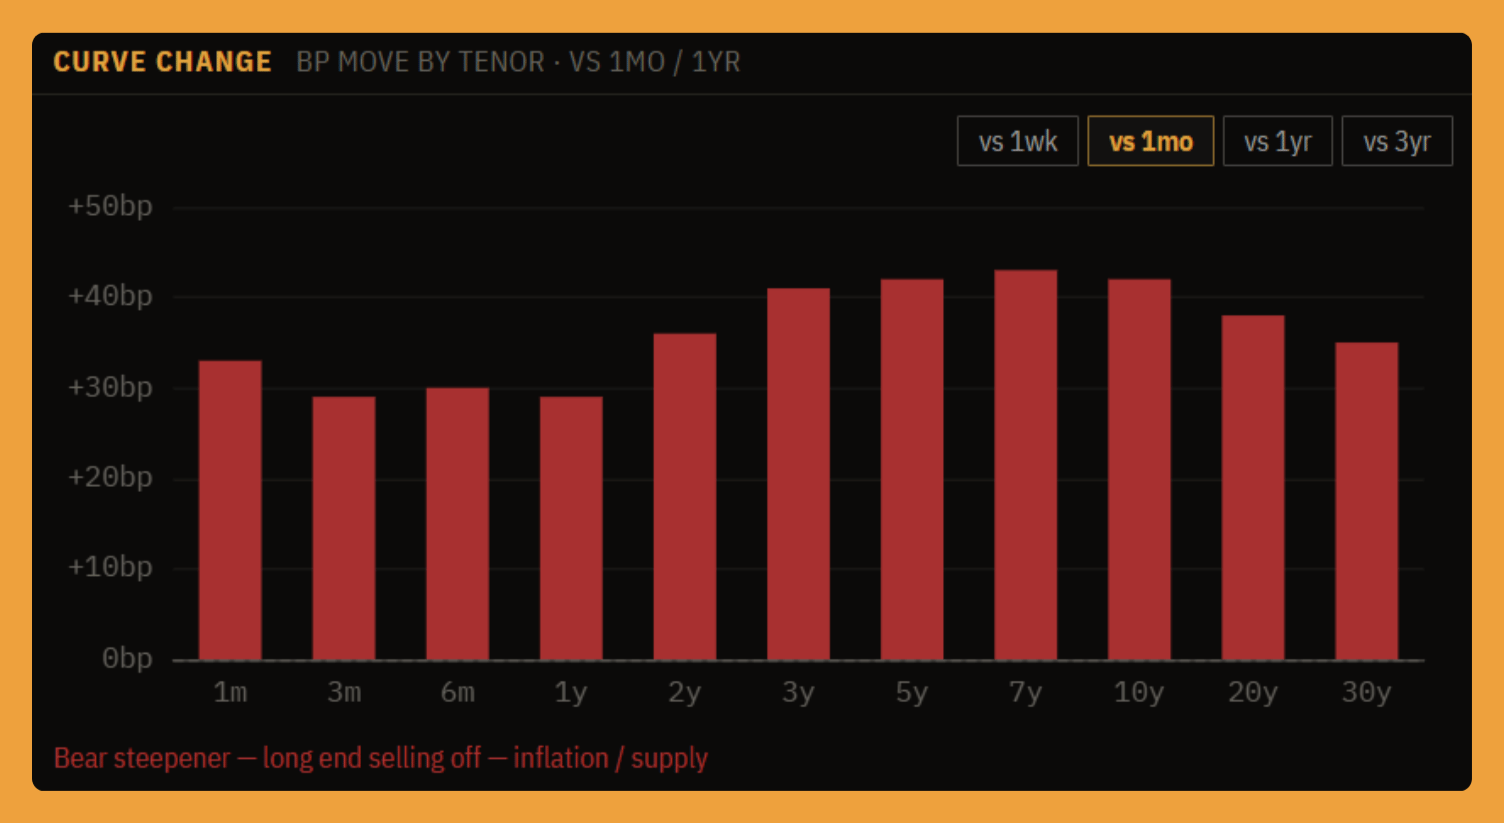
A single yield moving is noise. What matters is how the whole curve shifts, which is why it helps to look at today's curve against where it sat a month ago and a year ago. That comparison lets you name the move. A shift is the entire curve moving up or down together. A steepening is long yields rising faster than short ones, so the curve gets steeper. A flattening is the opposite, with the gap narrowing.
Over the past month this curve has bear-steepened: long-end yields sold off, meaning their prices fell and their yields rose, faster than the front end. That is a different picture from a year ago, and comparing the three dates is what makes the move legible at a glance.
What the forward curve shows
A forward curve shows where the market implies yields will sit in one, two, or three years' time, derived from today's prices. It is the bond market's own forecast of the path of rates, and laying it over today's curve shows you what is already priced in.
Why inversion matters, and where it misleads
Inversion earned its reputation: the 2s10s has gone negative before nearly every U.S. recession since the 1970s. But read it honestly. It is a tilt, not a timer; the lag from inversion to recession has run anywhere from six months to two years, so an inverted curve is not a signal to sell everything today. The un-inversion is often the real tell, because the economy has frequently turned after the curve climbs back out of inversion rather than while it is still inverted. And the 2s10s and 3m10y can disagree, which leaves you with a question rather than a clean signal.
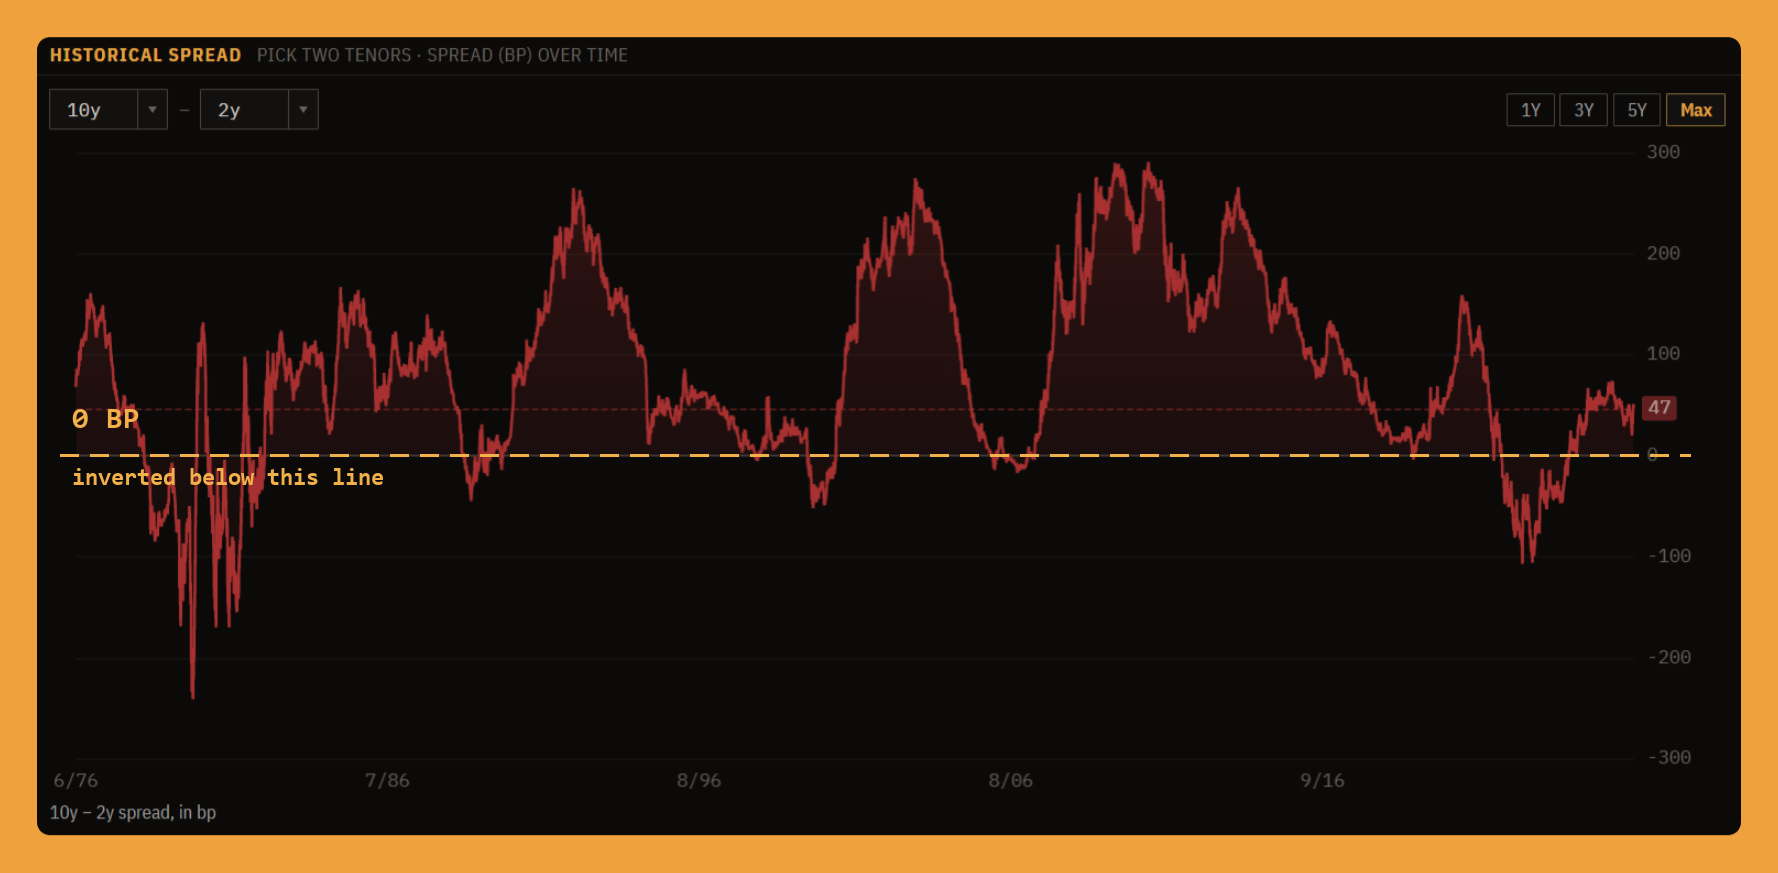
Warning: An inverted curve is a probability tilt, not a countdown. The lag to recession has run anywhere from six months to two years, and the economy has often turned only once the curve climbs back out. Read inversion as a regime signal, never a market-timing tool.
The bottom line
The yield curve packs the market's whole view of growth, inflation, and Fed policy into one line. Read it in that order: the shape first, upward-sloping, flat, or inverted, then the 2s10s and 3m10y spreads to see how close it sits to the recession line, then the month-ago and year-ago overlays to see which way it is moving. Today's curve is upward-sloping and bear-steepening, not inverted. The payoff of learning to read it is simple: when the front end climbs above the long end, you will recognize the signal the moment it appears.