A credit spread is the clearest read you get on how much fear is priced into corporate borrowing. It is the extra yield a company has to pay over the U.S. government to borrow for the same length of time, and that premium rises and falls with the market's appetite for risk. When spreads are tight, lenders are relaxed. When they widen, the market is bracing. Here is how to read them, and why the gap between investment grade and high yield is the tell that often moves before the stock market does.
What a credit spread actually is
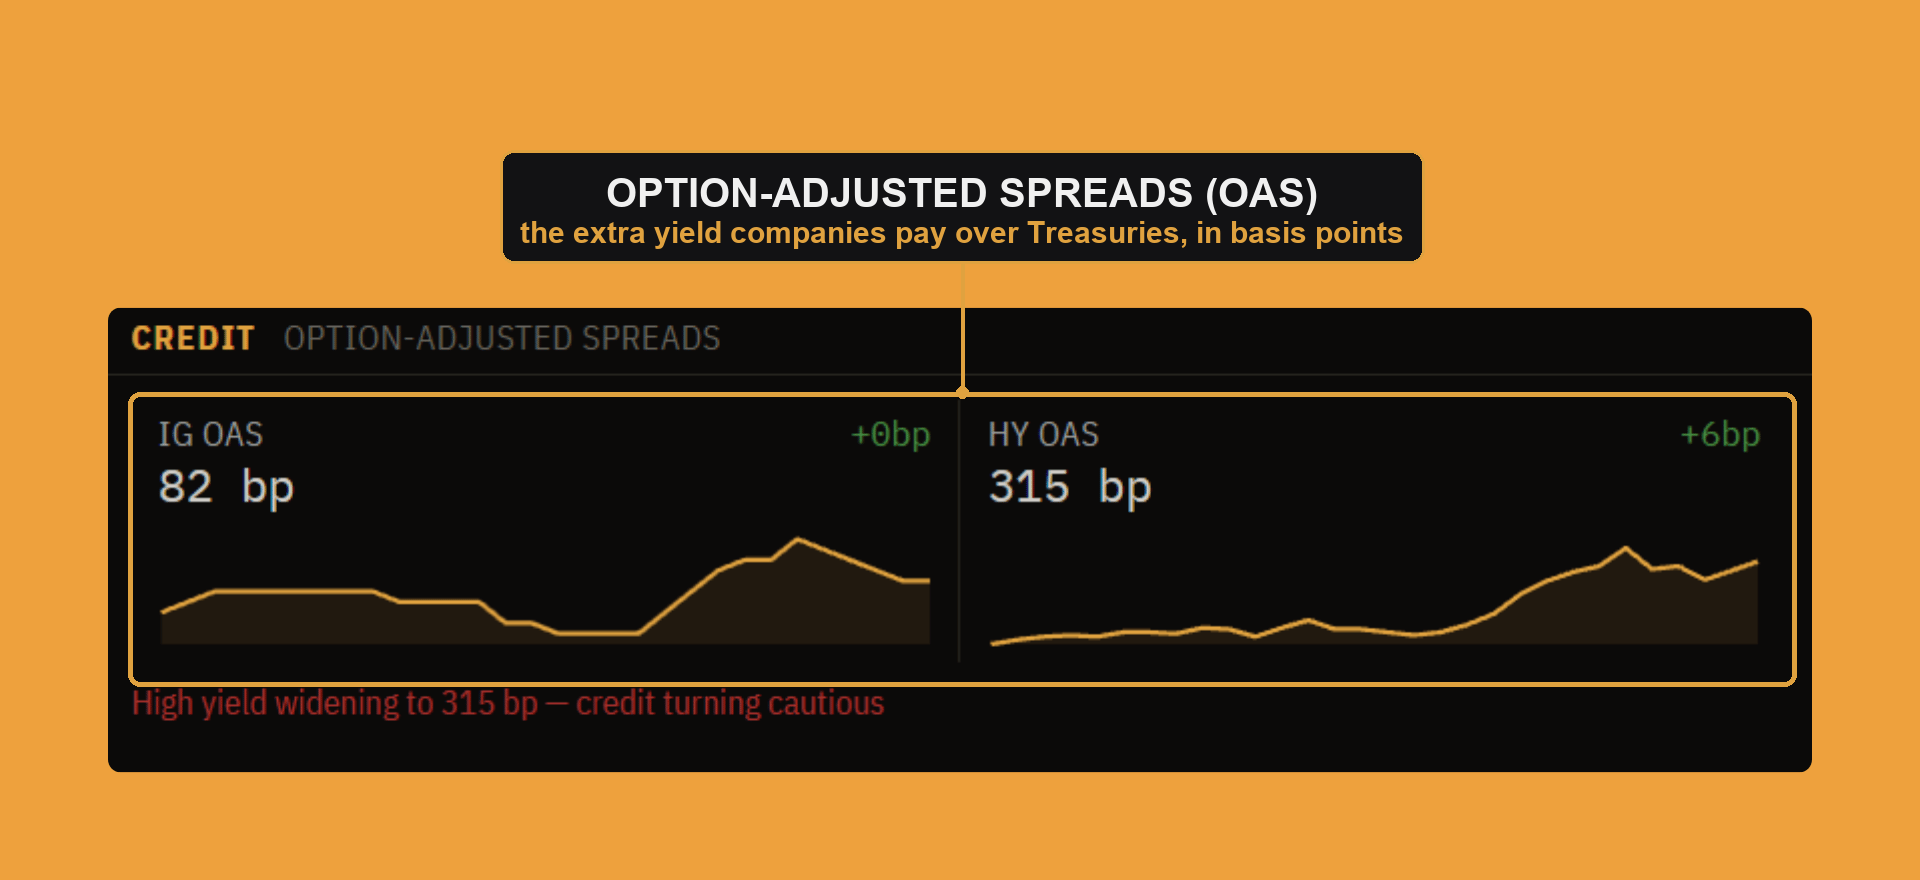
A Treasury yield is as close to risk-free as markets get, because the government prints the currency it borrows in. A company can default, so it has to pay more. The credit spread is that difference: the corporate bond's yield minus the matching Treasury yield, quoted in basis points (hundredths of a percent). A spread of 100 basis points means the company pays one full percentage point more than the government to borrow for the same maturity.
The number our panel shows is the OAS, the option-adjusted spread. Many corporate bonds can be called back early by the issuer, and that embedded option distorts a raw yield comparison. OAS strips the option out so you are comparing like for like, which is why it is the spread trading desks actually quote.
Investment grade versus high yield
Not all borrowers are equal, so credit splits into two tiers by rating. Investment grade (IG) is the high-quality end: the strongest balance sheets, rated BBB- and above. High yield (HY), also called junk, is everything below that, where a default is a real possibility rather than a remote one.
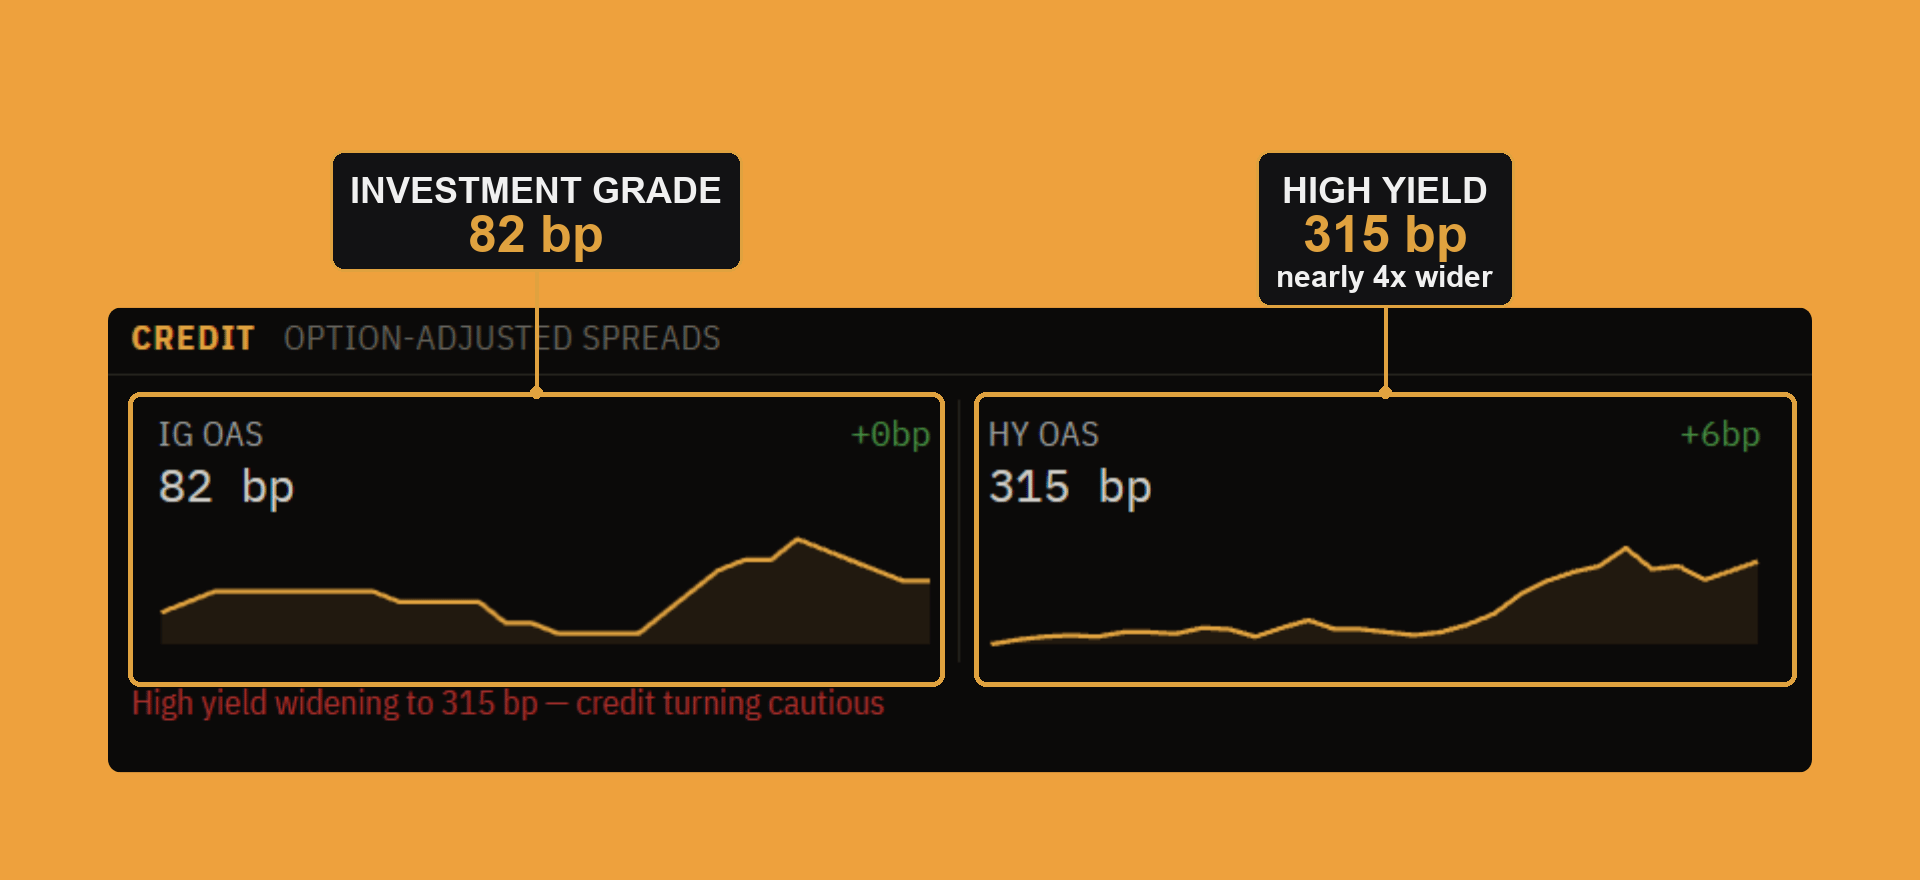
That quality gap shows up directly in the spread. On the panel right now, IG trades around 82 basis points while HY sits near 315, close to four times wider. Investors are not being irrational; they are demanding far more compensation to lend to the companies most likely to miss a payment. Read IG as your baseline for how calm credit is, and HY as the place stress shows up first.
Tight versus wide, risk-on versus risk-off
A spread has two directions and both carry a message. Tight, or narrowing, spreads mean lenders are comfortable: they will fund even shaky borrowers for a slim premium, which is close to the definition of a risk-on market. Wide, or widening, spreads mean the opposite: lenders are nervous, demand far more to take the risk, and in a real panic stop lending to the weakest names altogether.
The important part is the timing. Spreads widen on the expectation of trouble, not after defaults arrive. By the time companies are actually missing payments, the spread moved long ago. That is what makes credit a leading read rather than a lagging one. The panel labels each tier the same way: it tags investment grade as tight meaning risk-on, and calls high yield the risk barometer.
High yield is the barometer: watch the low-quality end first
When risk gets repriced, it gets repriced at the junk end first. The strongest companies can absorb a slowing economy; the weakest cannot, so their borrowing cost moves earliest and by the most. That is why the single most useful credit habit is watching high yield relative to investment grade.
Right now that gap is doing exactly what it does early in a stress episode. High yield has been climbing over recent weeks, to 315 basis points, while investment grade has barely moved from 82. The panel reads it out for you: high yield widening to 315 bp, credit turning cautious. It is the same risk backdrop that showed up in the yield curve, seen from the credit side. The low-quality end is the first to flinch.
Info: OAS stands for option-adjusted spread. Many corporate bonds can be redeemed early by the issuer, and that call option would skew a plain yield comparison. OAS removes it, so a move in the number reflects credit risk, not bond math.
Credit usually leads the stock market
High-yield spreads and the stock market are two windows onto the same thing: the market's appetite for risk. But the bond market tends to be the more sober of the two. Credit investors earn a fixed coupon and lose if the company stumbles, so they watch balance sheets closely and tend to turn cautious earlier than equity investors chasing upside.
That makes a divergence worth respecting. When stocks are making new highs while high yield is quietly widening, the two are telling different stories, and credit has the better track record of being right. It does not mean sell. It means the risk backdrop is less healthy than the index alone is letting on.
Warning: A spread is a tilt, not a timer. Tight spreads can stay tight for years, and a one-day move is noise. What matters is the trend and the gap between the tiers. Read widening high yield as an early caution, a reason to check your risk, not a signal to sell everything.
The bottom line
Credit spreads price the market's willingness to lend to companies, and they often say it before the stock market does. Read them in order: investment grade for the baseline, high yield for the fear, and the gap between the two for where the stress is building. Tight means calm, wide means caution, and the junk end moves first. Today high yield is widening while investment grade holds, which is the credit market's quiet way of saying risk is being repriced, exactly the kind of early signal learning to read spreads is for.