CPI is the most-watched number in markets, and for one reason: it is the clearest read on inflation, and inflation sets the path of interest rates. When the Consumer Price Index lands, bond yields, stocks, and the dollar can all move in the same minute, sometimes on a surprise of a tenth of a percent. The number itself is simple. Reading it the way a trading desk does is the part worth learning. Here is how.
What CPI actually measures
The Consumer Price Index tracks the price of a fixed basket of goods and services, everything from groceries and rent to gasoline, airfare, and haircuts, and reports how much that basket's cost has changed. The U.S. Bureau of Labor Statistics publishes it monthly, usually in the second week, for the month just ended.
You will see it two ways. Month-over-month (MoM) is the change from the prior month, the freshest read on momentum. Year-over-year (YoY) is the change versus twelve months ago, the headline figure people mean when they say inflation is running at some percent. Both matter: YoY tells you the level, MoM tells you the direction.
Headline versus core, and why the Fed watches core
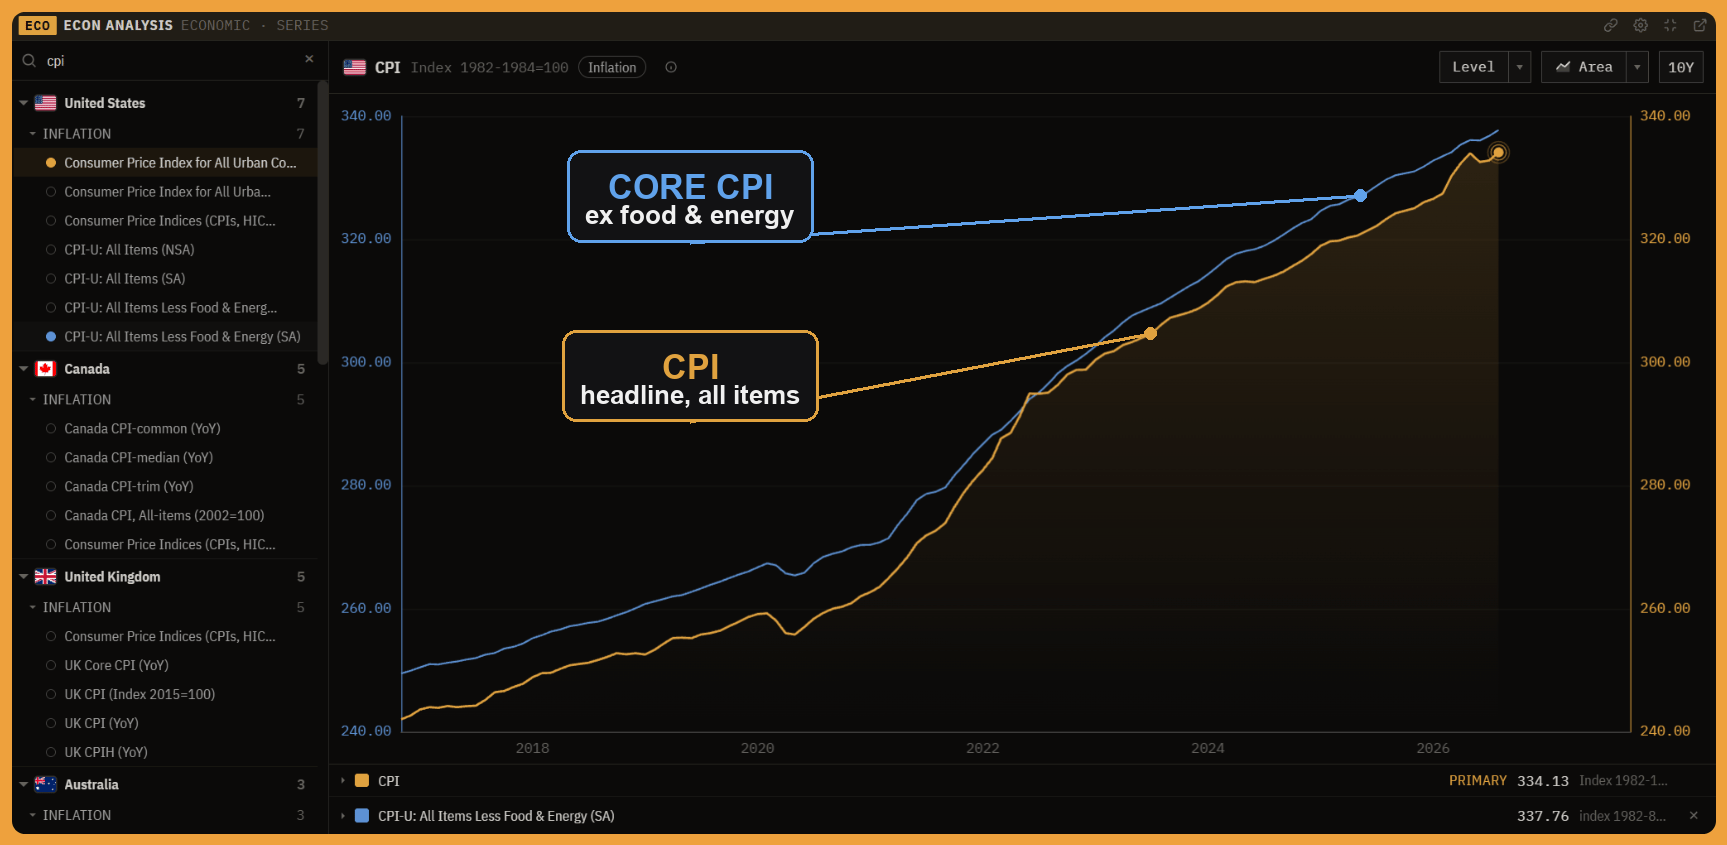
CPI comes in two flavors. Headline CPI includes everything. Core CPI strips out food and energy, the two categories whose prices swing hardest on things that have nothing to do with the underlying trend: a cold snap, an OPEC decision, a bad harvest. Those swings make headline noisy.
Core is the one policymakers lean on, because it is a cleaner read on where inflation is actually heading once the volatile pieces are set aside. When you hear a print was hot or cool, ask which one moved. A hot headline on a gasoline spike is a very different story from a hot core.
The only number that moves markets: the surprise
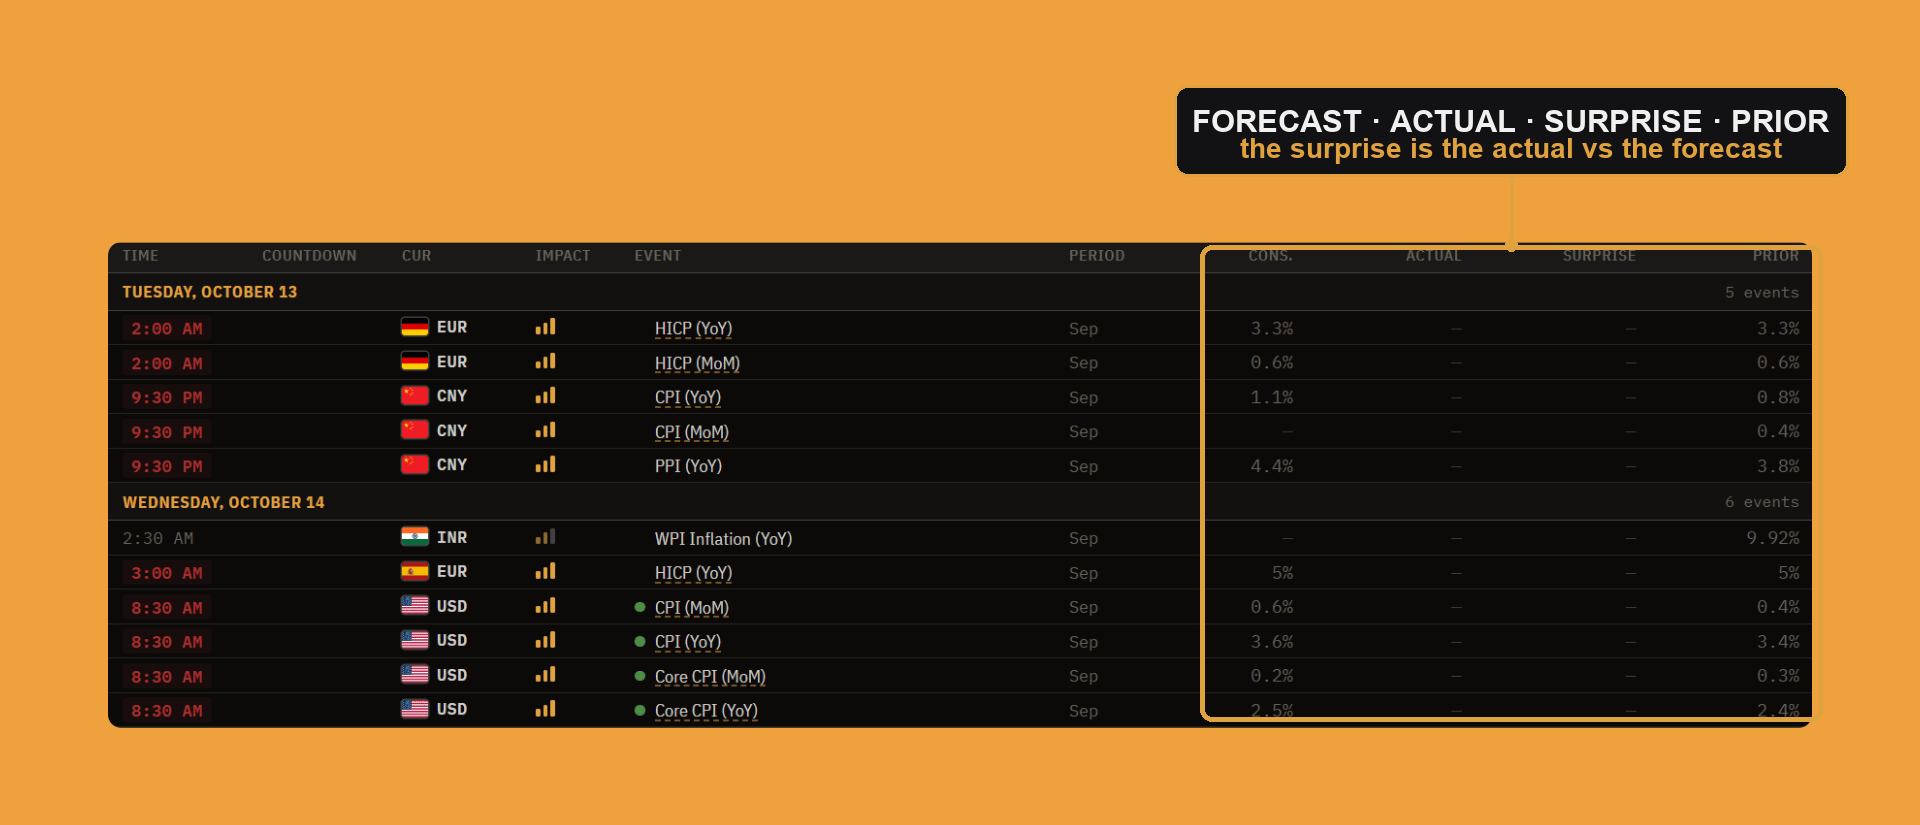
Here is the part most people miss. The market does not react to the CPI number. It reacts to the number relative to what was expected. Before every release, economists publish a consensus forecast, and that forecast is already priced into bonds and stocks. What moves markets is the surprise: how far the actual print lands from the forecast.
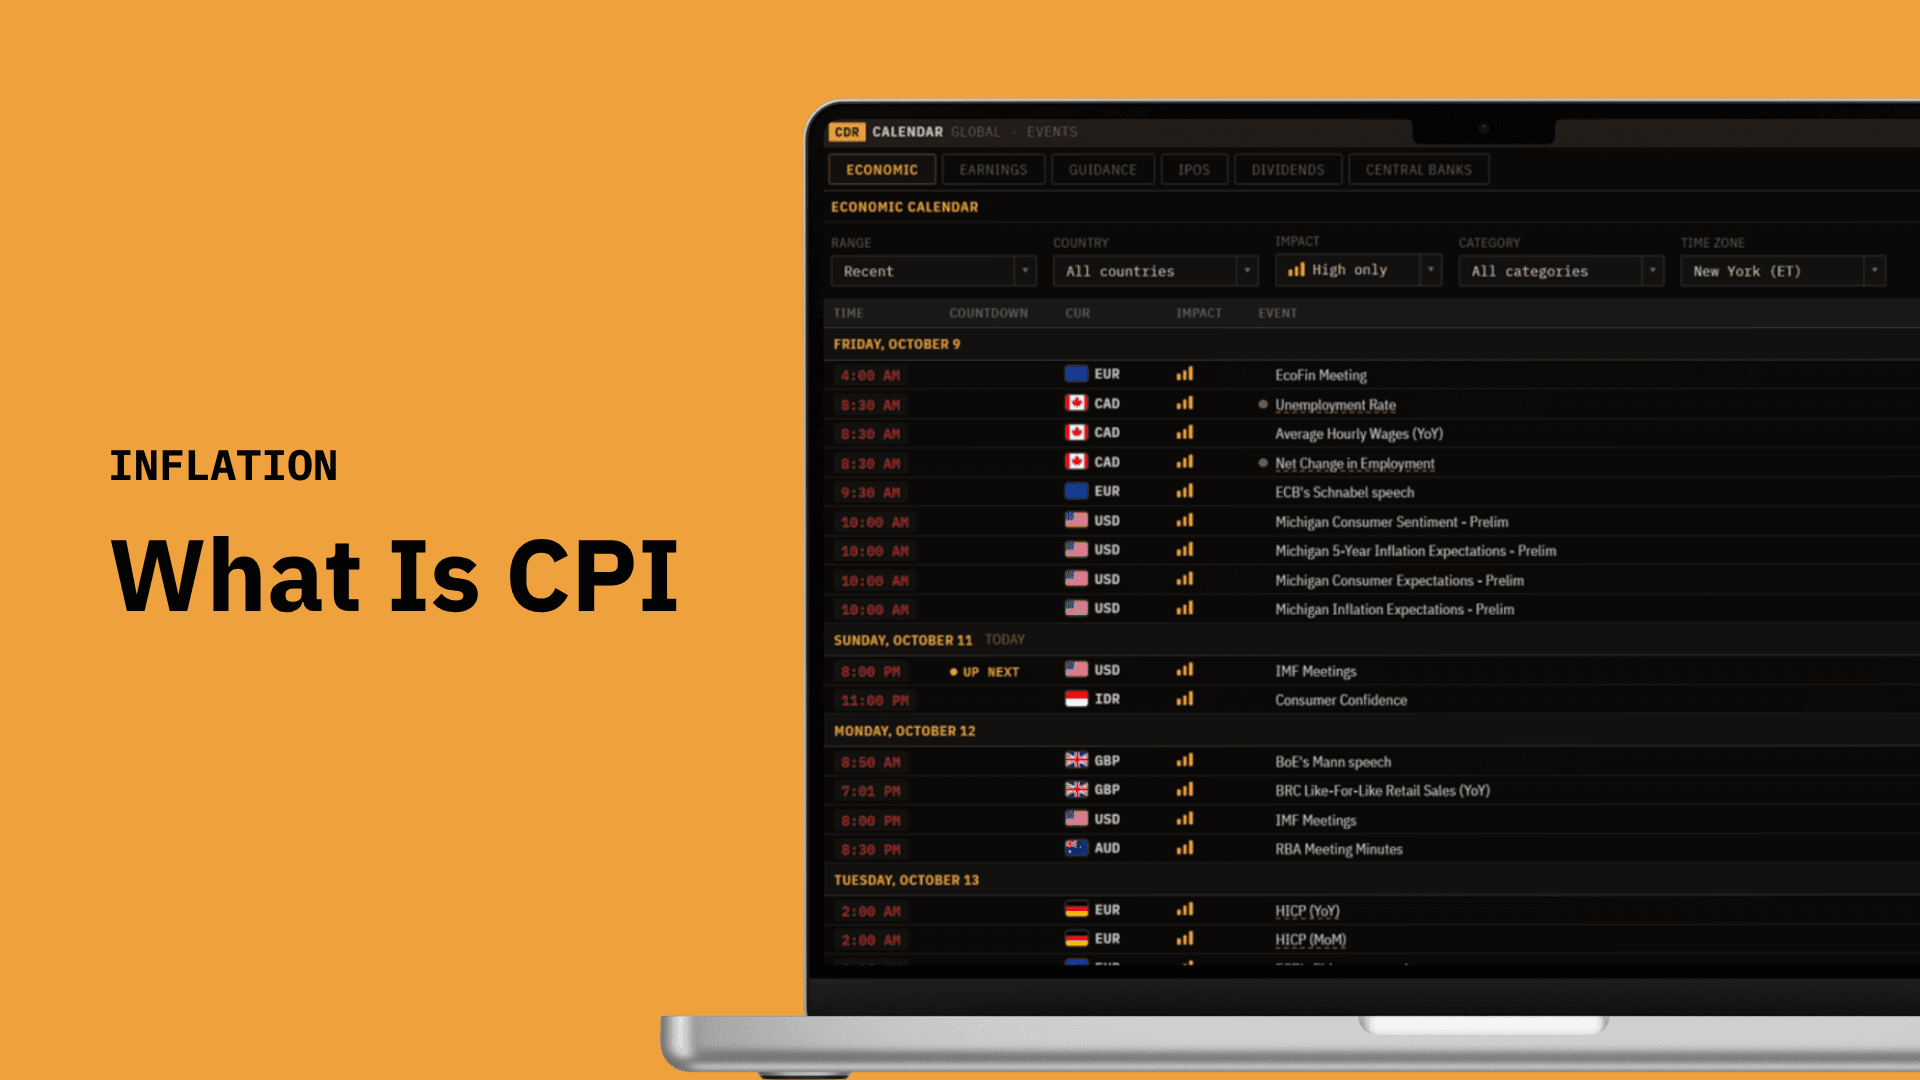
That is why the calendar shows three figures for every release: actual, forecast, and prior. A 3.2 percent print is bullish if the forecast was 3.4, and bearish if the forecast was 3.0, even though the number is identical. Read the surprise, not the headline.
What a hot or cool print does to the market
A hot CPI, inflation above forecast, tells the market the Federal Reserve may need to keep rates higher for longer. Rate-cut bets get pushed out, short-term yields rise, bond prices fall, the dollar usually firms, and stocks often sell off, growth names most of all. A cool CPI does the reverse: cut bets pull forward, yields fall, and risk assets tend to rally.
This is the same machinery behind the yield curve: inflation data moves rate expectations, and rate expectations move the whole curve. CPI is one of the biggest single inputs to that repricing.
CPI tells you the past, the market prices the future
One honest limit: CPI is backward-looking. It tells you what prices did last month. Markets are forward-looking, and they carry their own real-time inflation forecast inside bond prices, the breakeven rate, which our Rates panel tracks. A CPI print matters most when it changes that forward view, confirming or breaking the trend the market already expected. A single in-line print often does very little.
Info: The Fed's official target is 2 percent, but it is measured on PCE, not CPI. PCE weights the basket differently and usually runs a few tenths below CPI, so a 3 percent CPI does not mean the Fed is a full point from target. CPI is the timelier, more-watched print; PCE is the gauge the Fed actually steers by.
CPI around the world
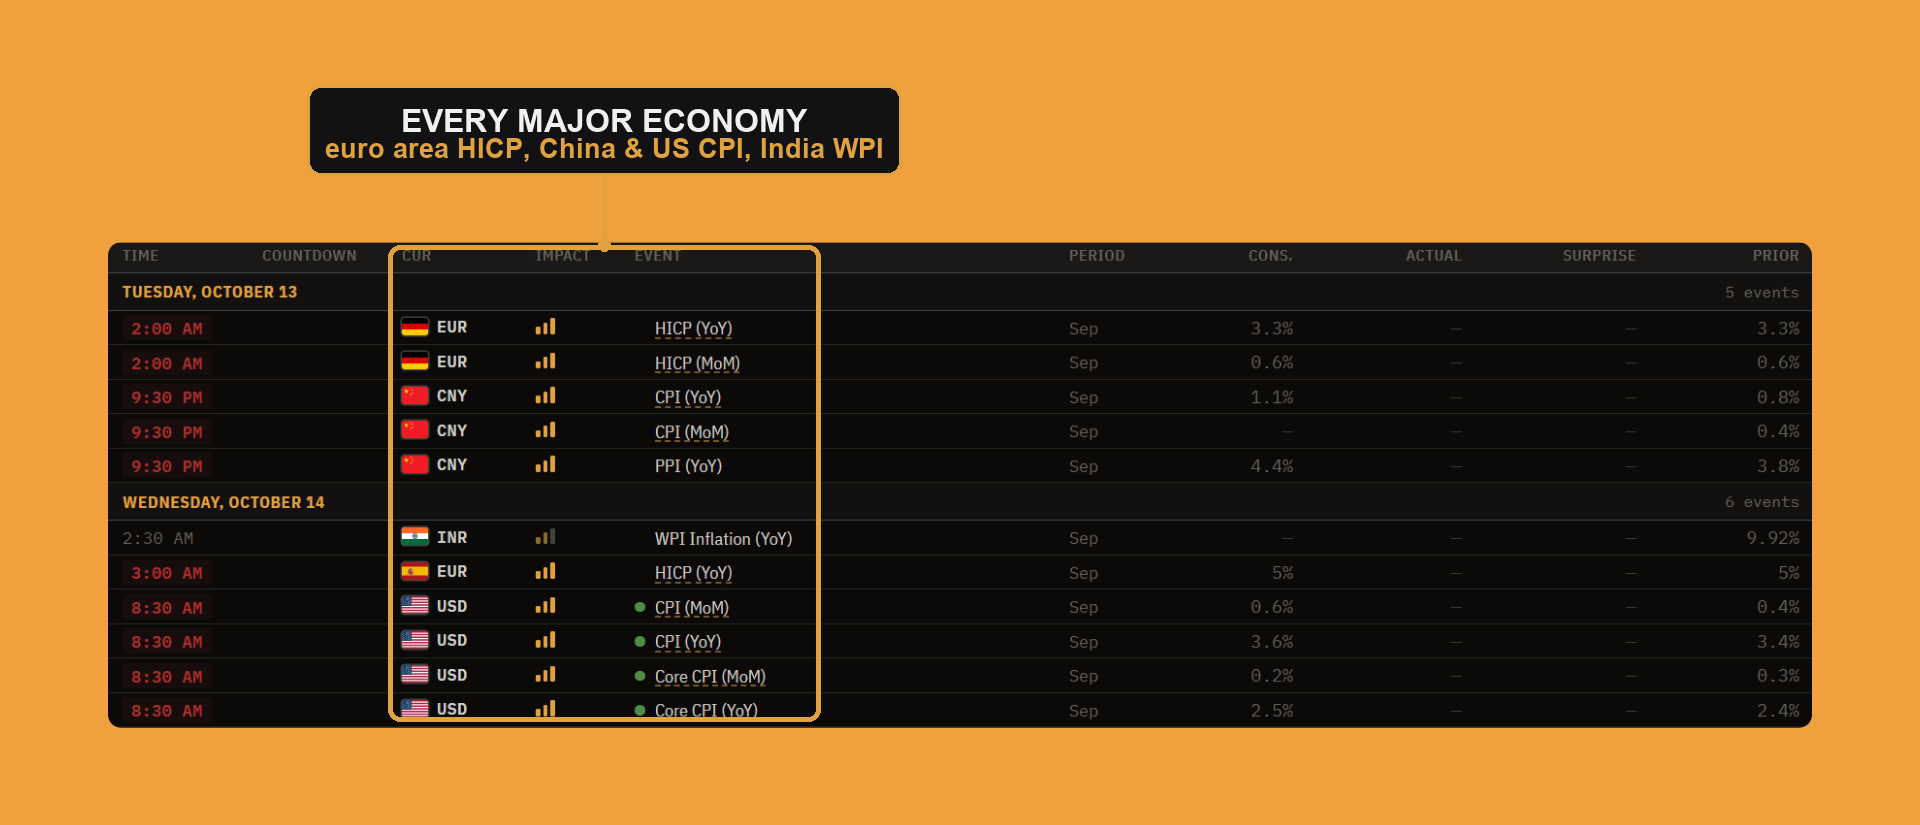
CPI is not just a U.S. number. Every major economy publishes one. The euro area's version is called HICP, the Harmonised Index of Consumer Prices, and the UK, Japan, China, Canada, and Australia each run their own. The concept is identical, and so is the market reaction, just pointed at a different central bank. A hot UK print lifts Bank of England rate expectations, so gilt yields and the pound climb; a cool euro area HICP does the opposite for the ECB, bunds, and the euro. For a trader, the local print is the main driver of that currency's pairs around the release.
One print still stands above the rest. U.S. CPI moves not just the Fed and Treasuries but global risk appetite and the dollar, so it ripples into every market, while the others mostly drive their own. Our economic calendar carries them all, so you can filter the Inflation category by country and line up euro area HICP, UK CPI, and the rest against the U.S. release.
How to read it like a desk
Put it together and a release takes about ten seconds to read. Check core against its forecast first, that is the signal. Note the direction of the surprise and its size. Then place it against the trend: is this print confirming a cooling path, or breaking it? The reaction you see in yields and the dollar is the market answering that question in real time.
Warning: One print is noise. CPI is revised, seasonal quirks distort single months, and the market can overreact to a number that later gets walked back. Trade the trend and the core, not a lone headline, and remember the move is about the surprise versus expectations, not the absolute level.
The bottom line
CPI is the market's inflation pulse, and it moves everything downstream, because it moves the Fed. Read core over headline, the surprise over the level, and the trend over any single month. Do that, and when the print drops and the screen lights up, you will understand not just what inflation did, but why the whole market just repriced in response.