Four times a year, earnings season arrives, and over a few busy weeks most public companies report how the last quarter went. A single report can move a stock 10 or 20 percent in the seconds after it hits, so this is where a lot of the action is. The thing to understand first is that a report is not one number. It is a handful of numbers plus an outlook, and what matters is not the numbers themselves but how they land against what the market already expected. Here is how to read one.
Where the numbers actually come from
A company does not just tweet its results. The numbers arrive through filings with the SEC, and three forms matter.
- The 8-K is a "current report" a company files when something material happens. On earnings day, the quarterly press release is attached to an 8-K, usually after the close or before the open. This press release carries the headline EPS, revenue, and the forward guidance, and it is what the market actually trades in the first minutes.
- The 10-Q is the full quarterly report, filed a little later, within about 40 days of the quarter's end. It is unaudited but detailed: the full income statement, balance sheet, cash-flow statement, and management's discussion of the results.
- The 10-K is the annual version, filed after the fourth quarter. It is audited, fuller, and includes the risk factors and a deeper management discussion. It replaces a Q4 10-Q.
Info: The press release on the 8-K comes first and is what moves the stock in real time. The 10-Q or 10-K follows with the fine print. If a stock gaps on the headline, then drifts over the next hour, that drift is often traders digging into the detail the press release left out.
Revenue and EPS: the two headline lines
Every report leads with two figures.
Revenue is the top line: total sales for the quarter, before any costs. It tells you how much business the company actually did.
EPS, or earnings per share, is the bottom line expressed per share. It is the company's net profit divided by its share count, so it is the slice of profit that belongs to each share you own. If a company earns 1 billion dollars and has 500 million shares, that is 2 dollars of EPS. EPS is what most headlines mean when they say a company "earned" a number.
Two details trip people up. First, diluted versus basic EPS: diluted divides profit by a larger share count that includes stock options, convertible debt, and grants that could turn into shares. Diluted is the more conservative figure and the one analysts track. Second, GAAP versus adjusted EPS: GAAP follows the official accounting rules, while "adjusted" or "non-GAAP" EPS strips out items management considers one-off. Companies lead with the adjusted number because it usually looks better.
Tip: When you compare a result to the forecast, make sure you are comparing like to like. Analyst consensus is almost always built on adjusted EPS, so check an adjusted actual against an adjusted estimate. Reading a GAAP actual against an adjusted estimate is how people convince themselves a company missed when it did not, or beat when it did not.
The number that moves the stock is the surprise
Here is the idea that explains almost every earnings-day move. The market does not trade the result. It trades the result against what was expected.
Before a company reports, Wall Street analysts publish their forecasts for revenue and EPS, and the average of those forecasts is the consensus estimate. That consensus is already baked into the share price. So what actually moves the stock is the surprise: how far the real numbers land from the estimate.
- A beat is a result above consensus.
- A miss is a result below it.
- In line means it came in about where expected.
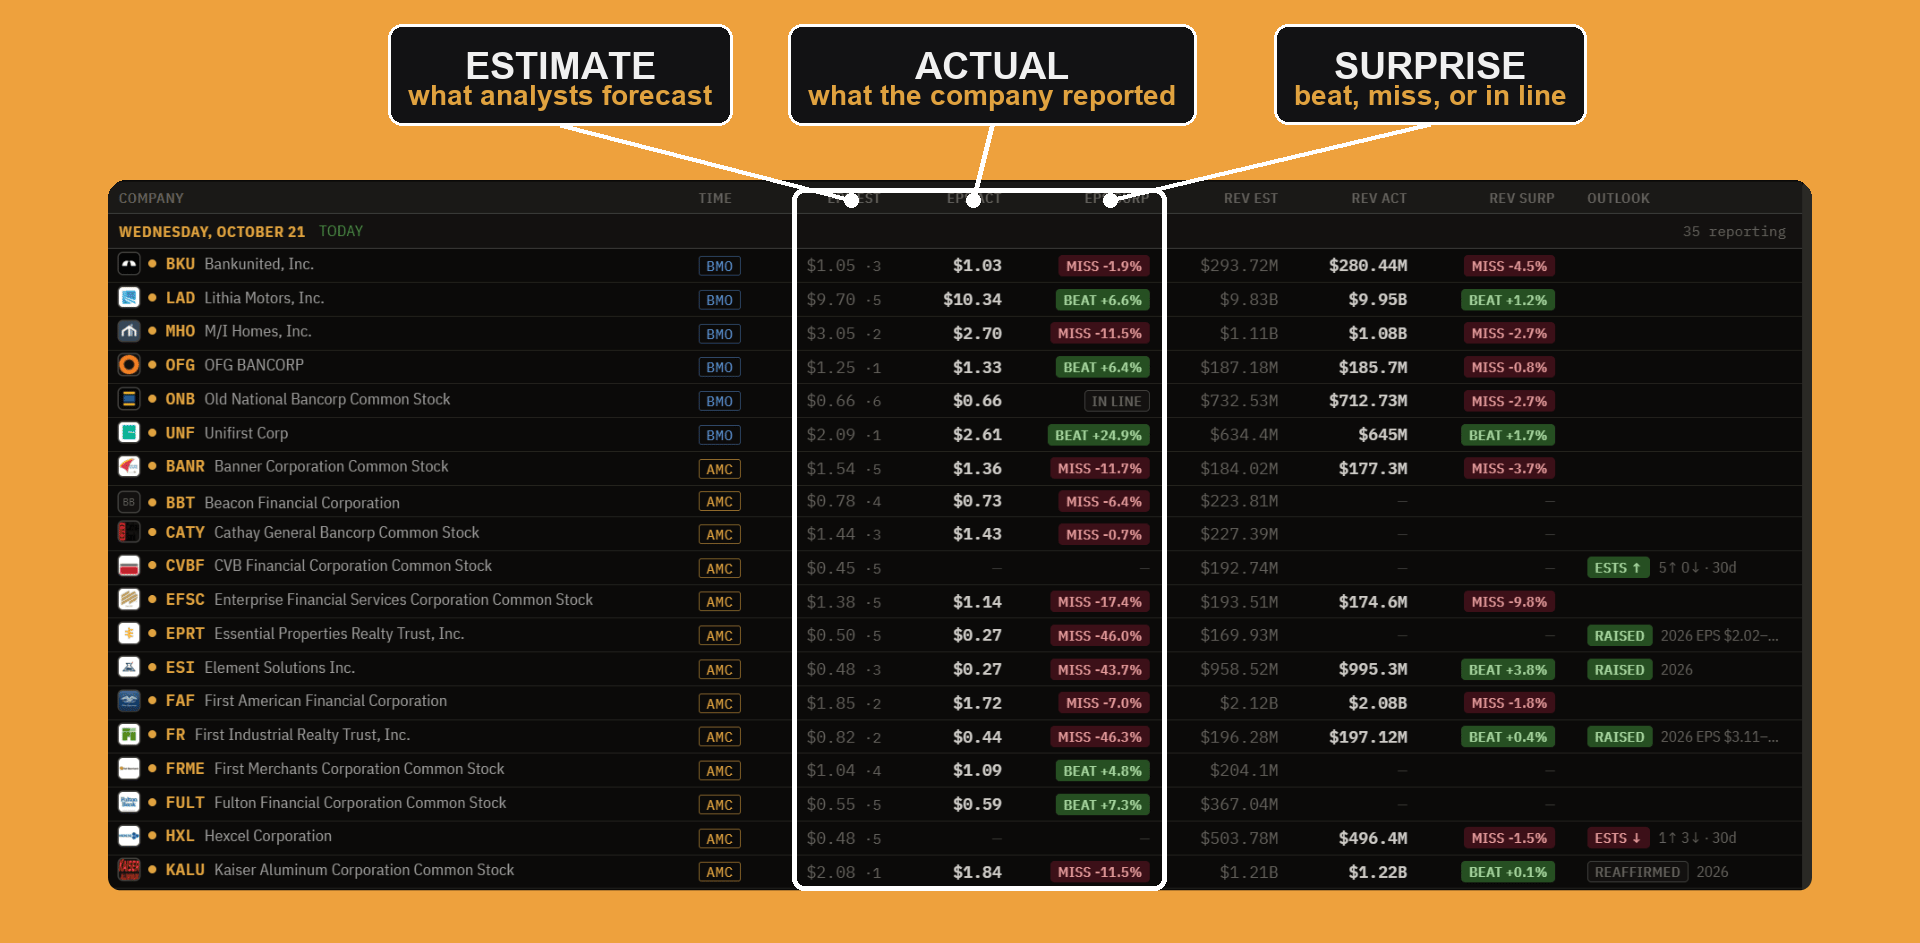
A result above forecast on both revenue and EPS is a double beat, and it is the cleanest bullish setup. A double miss is the opposite. Because the estimate is priced in, a company can post record profits and still fall if those profits were a hair short of what the Street penciled in.
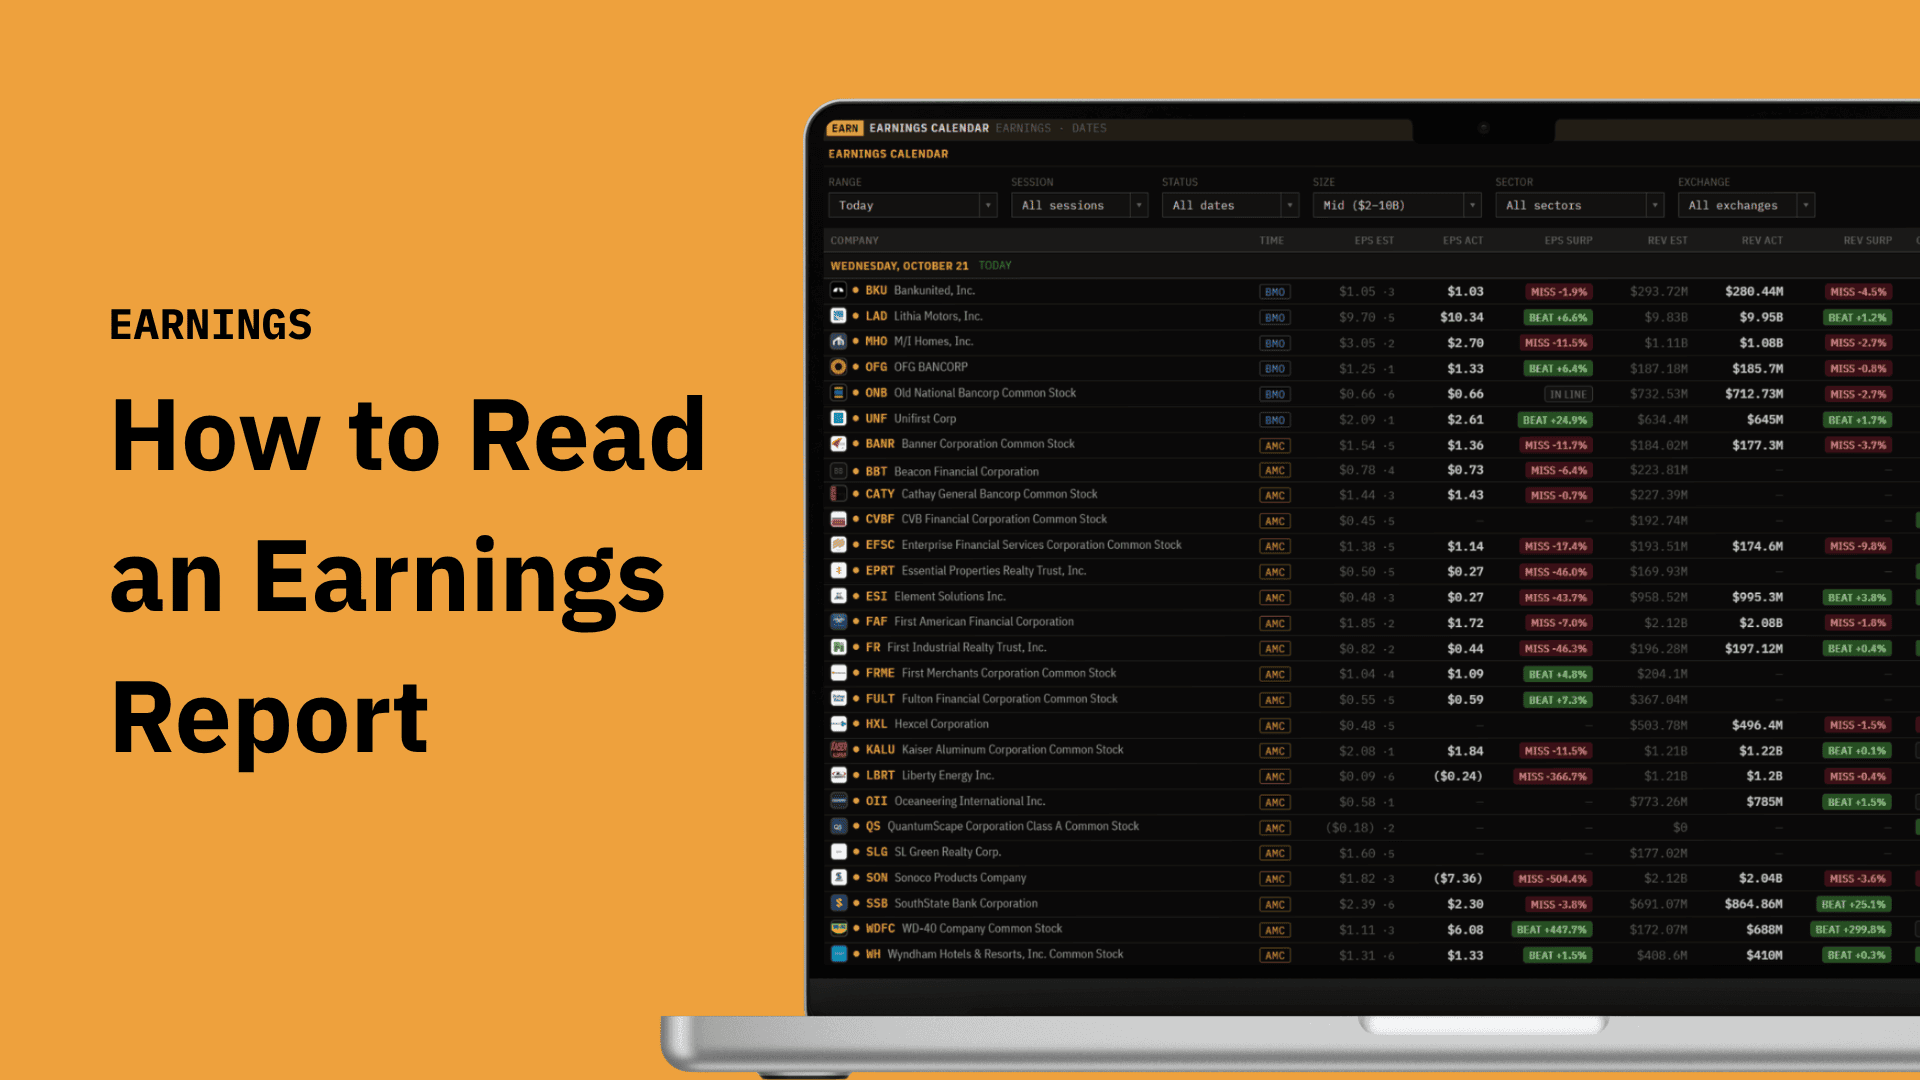
The Terminal's earnings calendar lays this out in columns, the estimate, the actual, and the surprise, side by side for every company reporting that day. One glance down the surprise column tells you who beat and who missed.
Why a beat can still sink a stock
This is the part that feels backwards until it clicks. Companies beat the published consensus most of the time, because management guides analysts toward a number it is confident it can clear. So the real bar is often higher than the printed estimate, a level traders call the "whisper number." Clear the consensus but miss the whisper, and the stock can drop on a beat.
More often, the culprit is the outlook. A company can beat on the quarter and still crater if its guidance for the next quarter comes in soft, because the market is forward-looking and cares more about the next few quarters than the one that just ended. A beat built on a one-time tax benefit or a wave of buybacks, rather than on real sales growth, also gets faded once traders read past the headline. When a stock is priced for perfection, even a good quarter has to be great.
Guidance: the outlook is usually the real story
Guidance is management's own forecast for what is coming, typically a range for next quarter's and the full year's revenue, EPS, and sometimes margins. It is the most forward-looking thing in the report, and it frequently moves the stock more than the results themselves.
- Guiding up, or raising guidance, means management lifted its forecast. It is a vote of confidence and usually bullish.
- Guiding down, or cutting guidance, means it lowered the bar. Even on a strong quarter, a cut can sink the stock.
- Reaffirming means it left guidance unchanged, which markets read as steady.
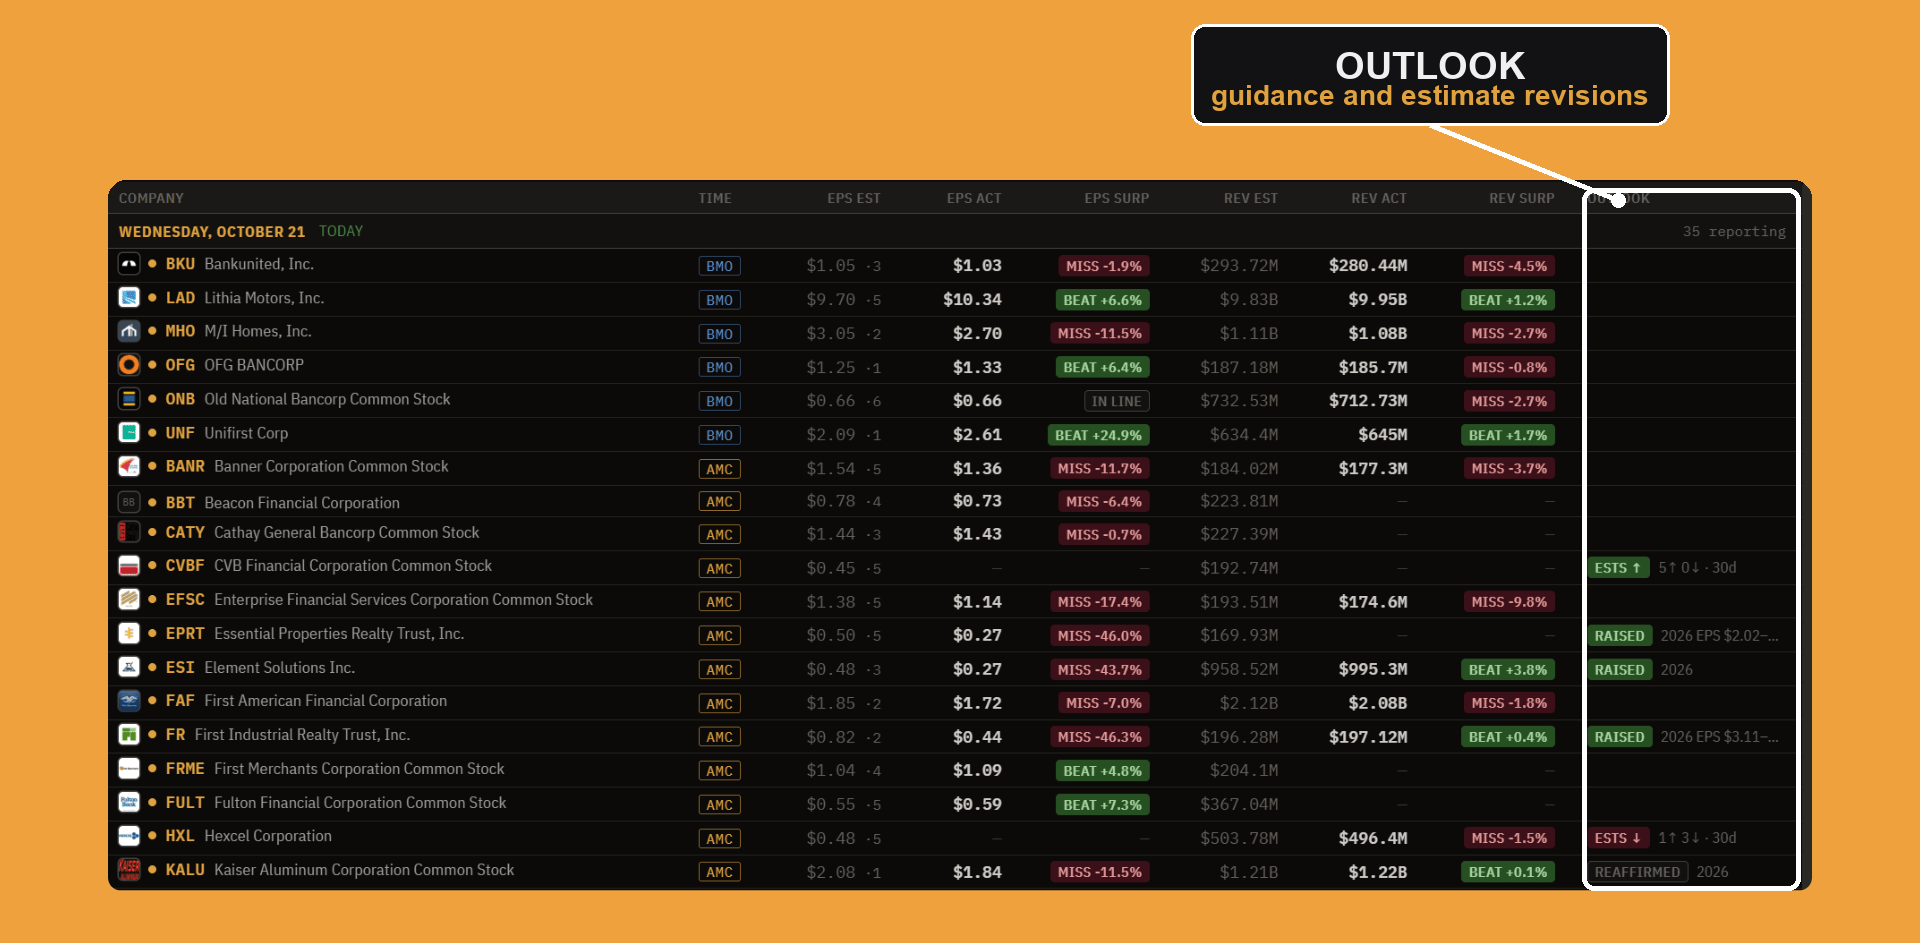
Not every company gives guidance, and some give only broad ranges, but when it is there, read it before you celebrate or mourn the quarter. A beat-and-raise, a quarter that beats and lifts guidance, is the gold standard. A beat-and-lower is a trap that catches people who stopped reading at the headline.
The calendar flags it in an outlook column, so you can see at a glance who raised, who reaffirmed, and who cut, with the estimate revisions that follow sitting right beside it.
Estimate revisions: the slower signal
The surprise is the instant reaction. Estimate revisions are the slow one, and they often matter more over time.
After a company reports and lays out its guidance, analysts update their models and revise their forecasts for the quarters ahead, up or down. A steady drift of upward revisions tends to support a stock for weeks, because it means the people who set the bar keep raising it. A wave of downward revisions does the reverse. Revisions also set the bar for next time: if estimates have been marched higher all quarter, the company has more to clear, which is how a good business can still deliver a disappointing print.
How to read a report like a desk
Put it together and a report takes under a minute to read in the right order.
- Revenue and EPS against consensus. Is it a double beat, a double miss, or mixed? That is the surprise.
- Guidance for the next period against consensus. This is often the real driver. Beat-and-raise or beat-and-lower changes everything.
- The quality of the number. Adjusted versus GAAP, margins, and whether the beat came from sales or from one-time items and buybacks.
- The reaction. How the stock actually moved tells you what was already priced in. A drop on a beat means expectations were higher than the published estimate.
- The revisions in the days after, as analysts reset the bar.
That whole sequence is what the earnings calendar is built to show. For every company reporting, the estimate, the actual, the surprise, and the outlook line up in a single row, so you can read the market's verdict across the entire day at a glance instead of chasing one headline at a time.
Warning: A "beat" is always relative to expectations, never an absolute good. The same EPS can be a blowout for one stock and a disaster for another, depending on what was priced in. Read the surprise, the guidance, and the reaction together, and never judge a quarter by the headline number alone.
The bottom line
An earnings report is a company grading itself against the market's expectations. The headline EPS and revenue come from an 8-K press release, with the full detail in the 10-Q or 10-K that follows. What moves the stock is the surprise, how the result lands against consensus, not the number itself. And the outlook usually matters most of all: guidance and the estimate revisions that follow it tell you where the next few quarters are headed, which is what the market is really trying to price. Read all of it in order, and earnings season gets a lot less noisy.