Alongside CPI, the monthly jobs report is the heavyweight of the economic calendar. It lands on the first Friday of the month at 8:30 in the morning, and in the minutes after, bond yields, stocks, and the dollar can all lurch at once. The twist that trips people up: a strong jobs report can send stocks down. Here is how to read it, and why.
What the jobs report actually is
The report's official name is the Employment Situation, published by the U.S. Bureau of Labor Statistics for the month just ended. It is really three reports in one, and each moves markets in its own way:
- Nonfarm payrolls (NFP) is the headline: the net number of jobs the economy added or lost, drawn from a survey of businesses. "Nonfarm" just means it excludes farm work and a few other categories.
- The unemployment rate is the share of people who want a job and cannot find one, drawn from a separate survey of households.
- Average hourly earnings is wage growth, and it is the line that connects the jobs report back to inflation and the Fed.
Read all three together. A single one in isolation can mislead you.
Payrolls: the headline number
Nonfarm payrolls is the figure the headlines lead with. As a rough gauge, the economy needs somewhere around 100,000 to 150,000 new jobs a month just to keep pace with population growth, so prints well above that signal a strong labor market and prints below it signal one that is cooling.
The catch most beginners miss is revisions. Every report revises the prior two months, and those revisions are often larger than the surprise in the current month. A headline that beats by 50,000 means little if the prior two months were quietly cut by 80,000. Always read the revisions next to the headline.
The unemployment rate, and why it can mislead
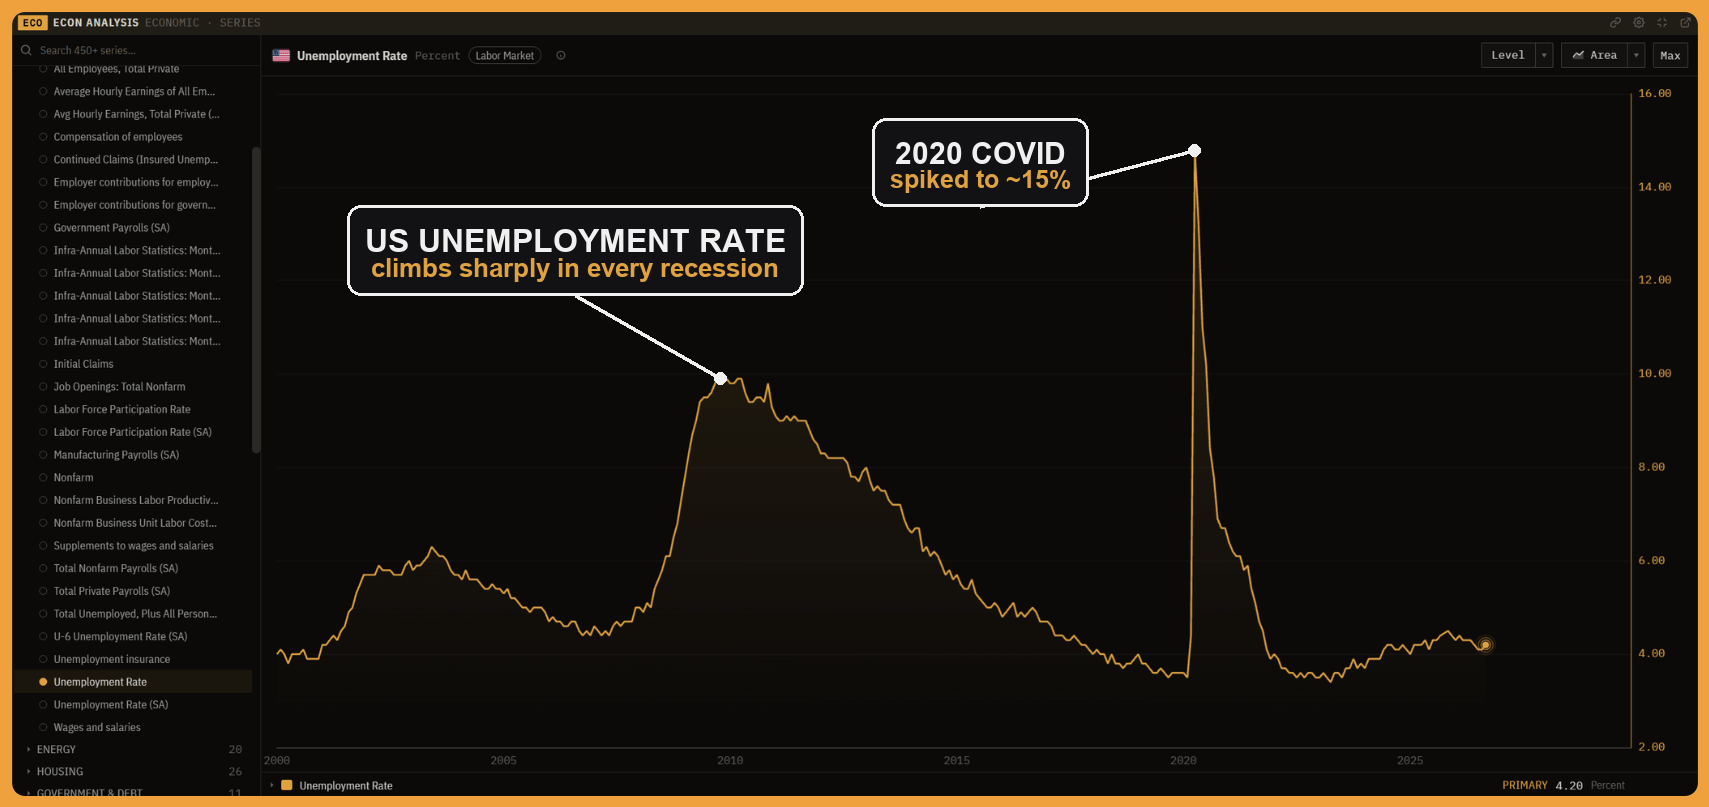
The unemployment rate looks simple, but it moves for two very different reasons. It falls when people find jobs, which is healthy. It also falls when people give up looking and leave the labor force entirely, which is not. To tell them apart, watch the participation rate alongside it, the share of working-age people who are actually in the labor force. A falling unemployment rate on rising participation is strength; a falling rate on shrinking participation can be weakness in disguise.
Wages: the bridge to inflation and the Fed
Average hourly earnings is the quietest number in the report and often the most important. Wage growth feeds directly into inflation: if pay is rising fast, companies raise prices to cover it, and the Fed worries about that spiral. So a jobs report with strong payrolls and hot wages is a double signal to keep interest rates high. This is the thread that ties the jobs report to CPI and to the whole path of rates.
The surprise, and why good news can be bad news
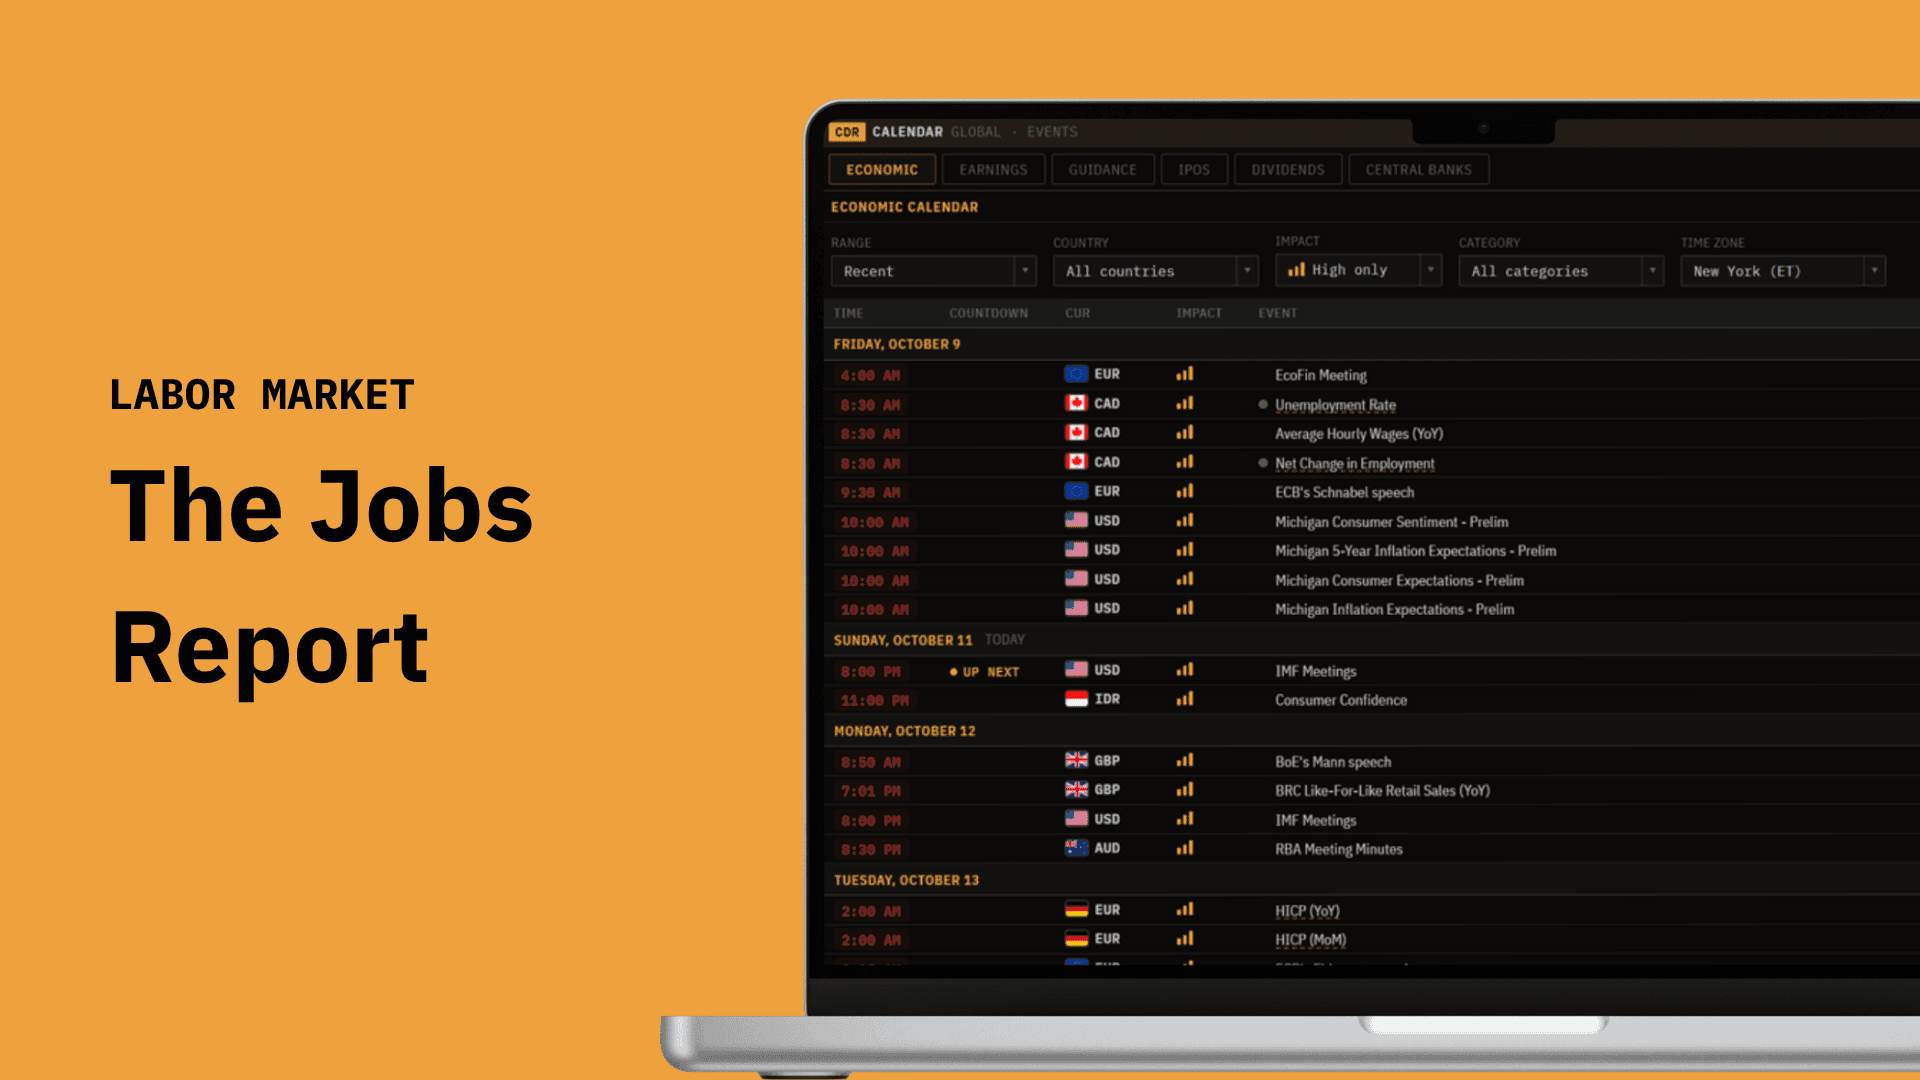
As with every release, the market does not trade the number, it trades the number against what was expected. The consensus forecast is already priced in, so what moves markets is the surprise, how far the actual print lands from the forecast. The calendar shows it directly: forecast, actual, and prior for every line.
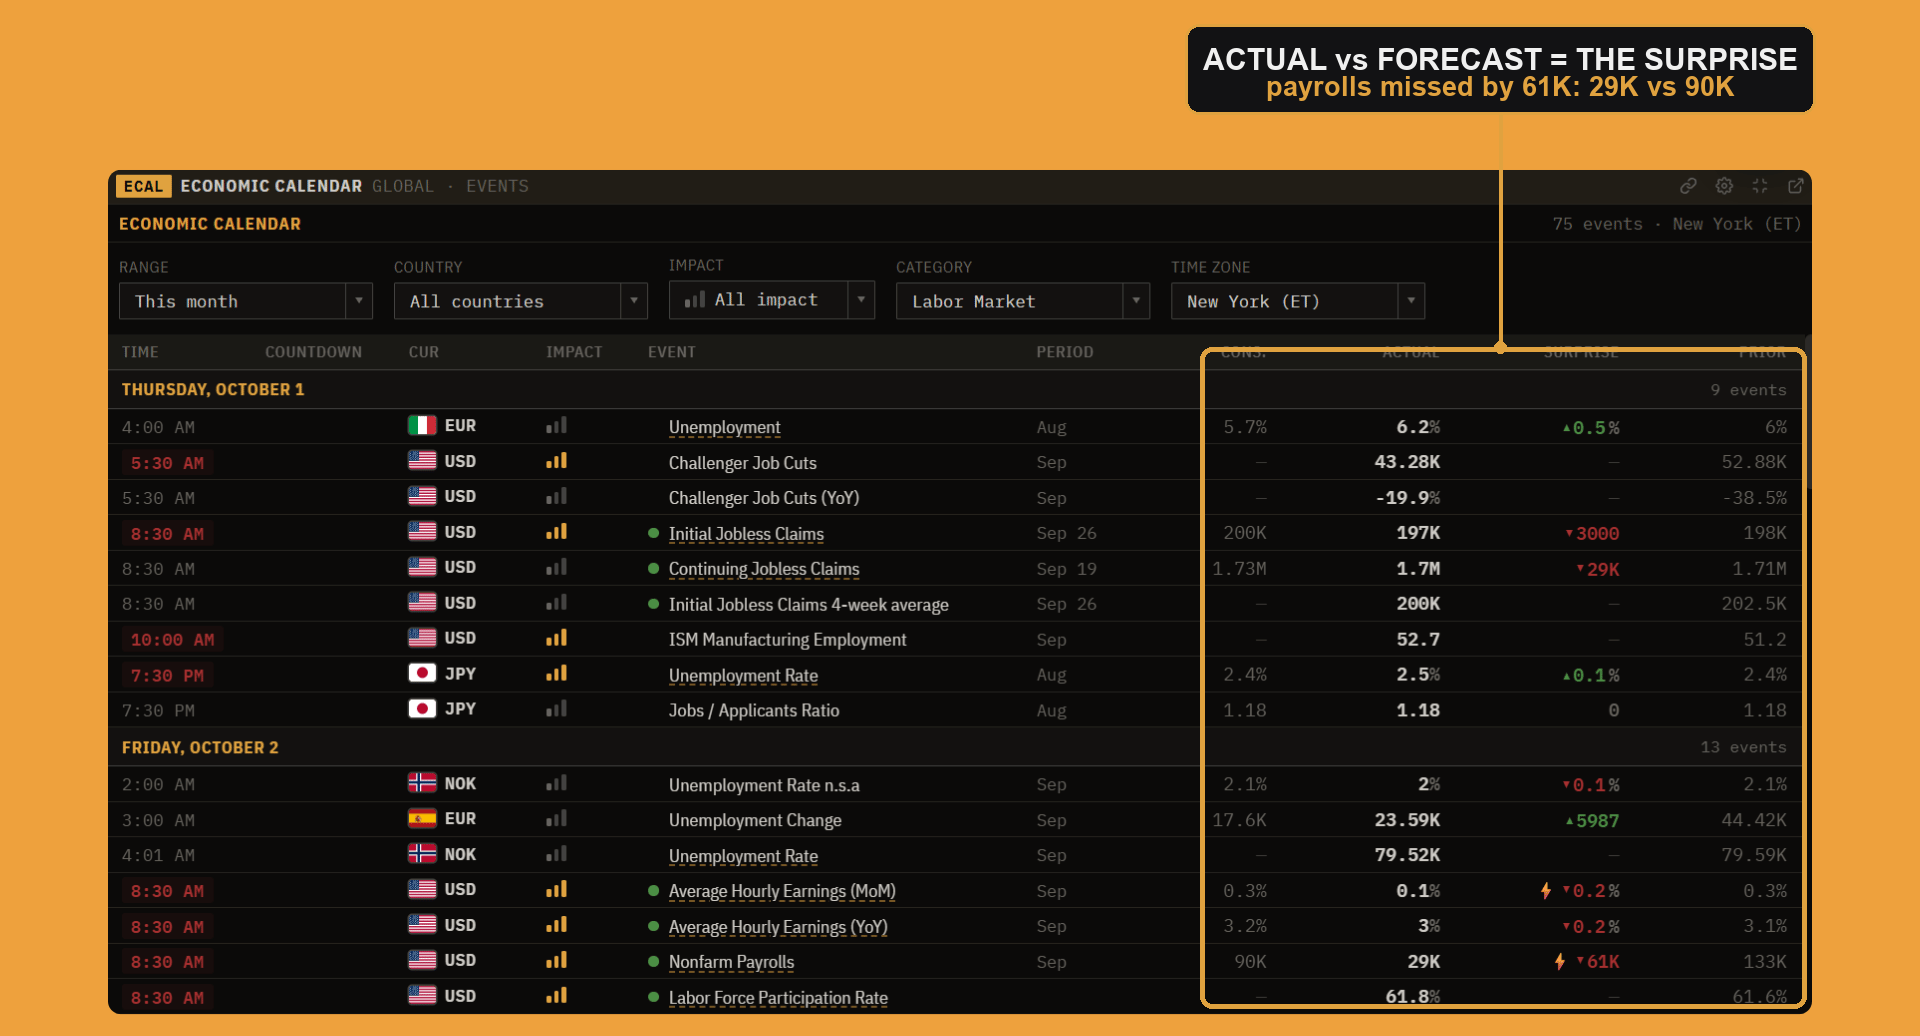
Here is the part that confuses people. When the Fed is trying to cool inflation, a hot jobs report, growth above forecast, tells the market the Fed can stay higher for longer. Rate-cut bets get pushed out, yields rise, the dollar firms, and stocks often fall. Strong economy, falling stocks. That is the "good news is bad news" reflex, and it is the single most counterintuitive thing about trading the number. A weak report flips it: cut bets pull forward and risk assets tend to rally on bad news.
The jobs report around the world
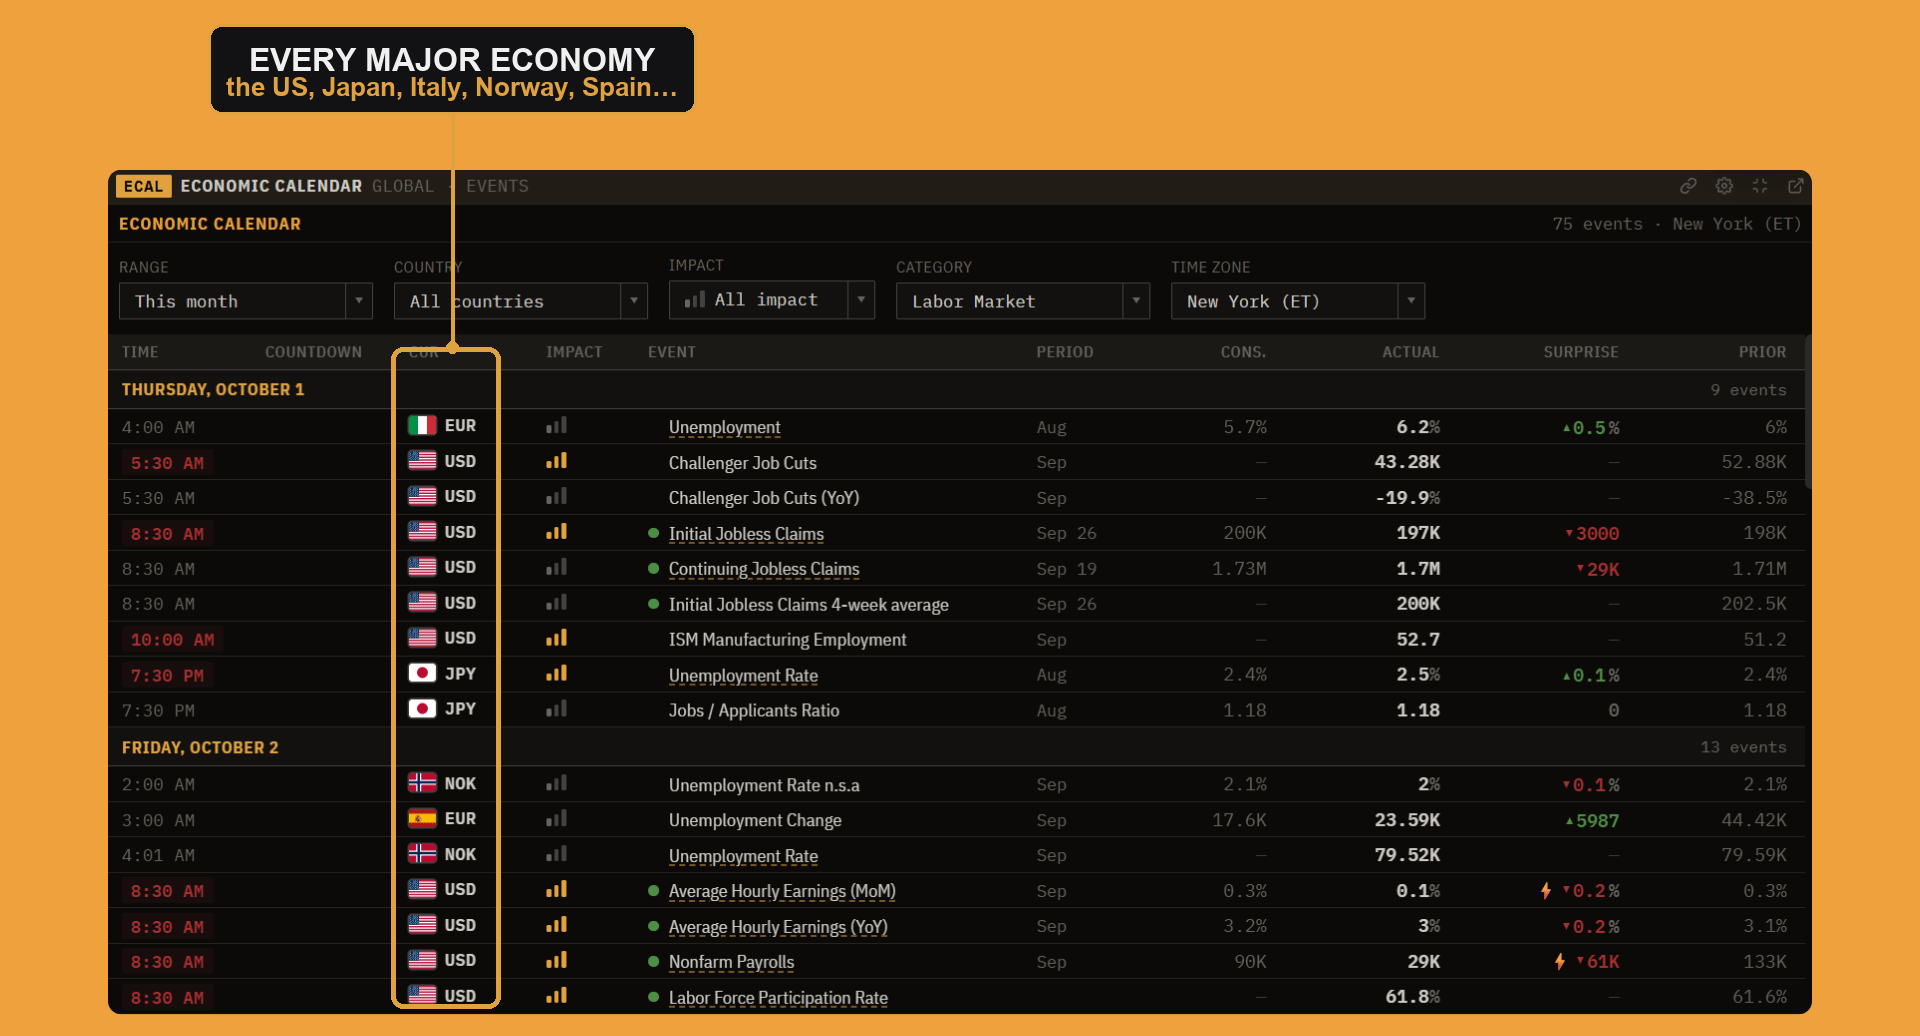
The U.S. jobs report is not the only one. Every major economy publishes its own, and each moves its own central bank, currency, and bonds the same way. The U.K. releases a claimant count, an unemployment rate, and average earnings that the Bank of England watches closely; Canada and Australia publish monthly employment-change reports that drive the loonie and the Aussie dollar; the euro area reports its unemployment rate for the ECB.
The U.S. report still stands above the rest, because it moves global risk appetite and the dollar, so it ripples into every market, while the others mostly drive their own. Our economic calendar carries them all, so you can filter the Labor Market category by country and line up the U.S. jobs report against the U.K., Canadian, and Australian releases.
Info: Payrolls and the unemployment rate come from two different surveys, businesses for payrolls and households for the jobless rate, so they can disagree in any single month. One can be strong while the other softens. That is noise in the methods, not a contradiction. Trust the trend across both, not one month's gap.
How to read it like a desk
A jobs report takes about fifteen seconds to read in order. Start with payrolls against the forecast, that is the surprise. Then check the revisions to the prior two months, which often matter more than the headline. Then read wages, the inflation angle the Fed cares about. Then the unemployment rate alongside participation. The move you see in yields and the dollar is the market pricing what all of that means for the Fed.
Warning: Payrolls is one of the noisiest numbers in all of economics and is heavily revised, so a single month is close to meaningless. The three-month average is the real signal. And remember the reaction is about the Fed, not a simple "jobs good, stocks up," so a great report can tank the market when inflation is the worry. Read the trend and the revisions, never a lone print.
The bottom line
The jobs report is the economy's pulse on employment, and it moves markets because it moves the Fed, through both growth and wages. Read the surprise, the revisions, and wages together, watch the unemployment rate with participation beside it, and remember that good news can be bad news when the Fed is tight. Next to CPI, it is the release that sets the path of interest rates, which is to say the path of everything.