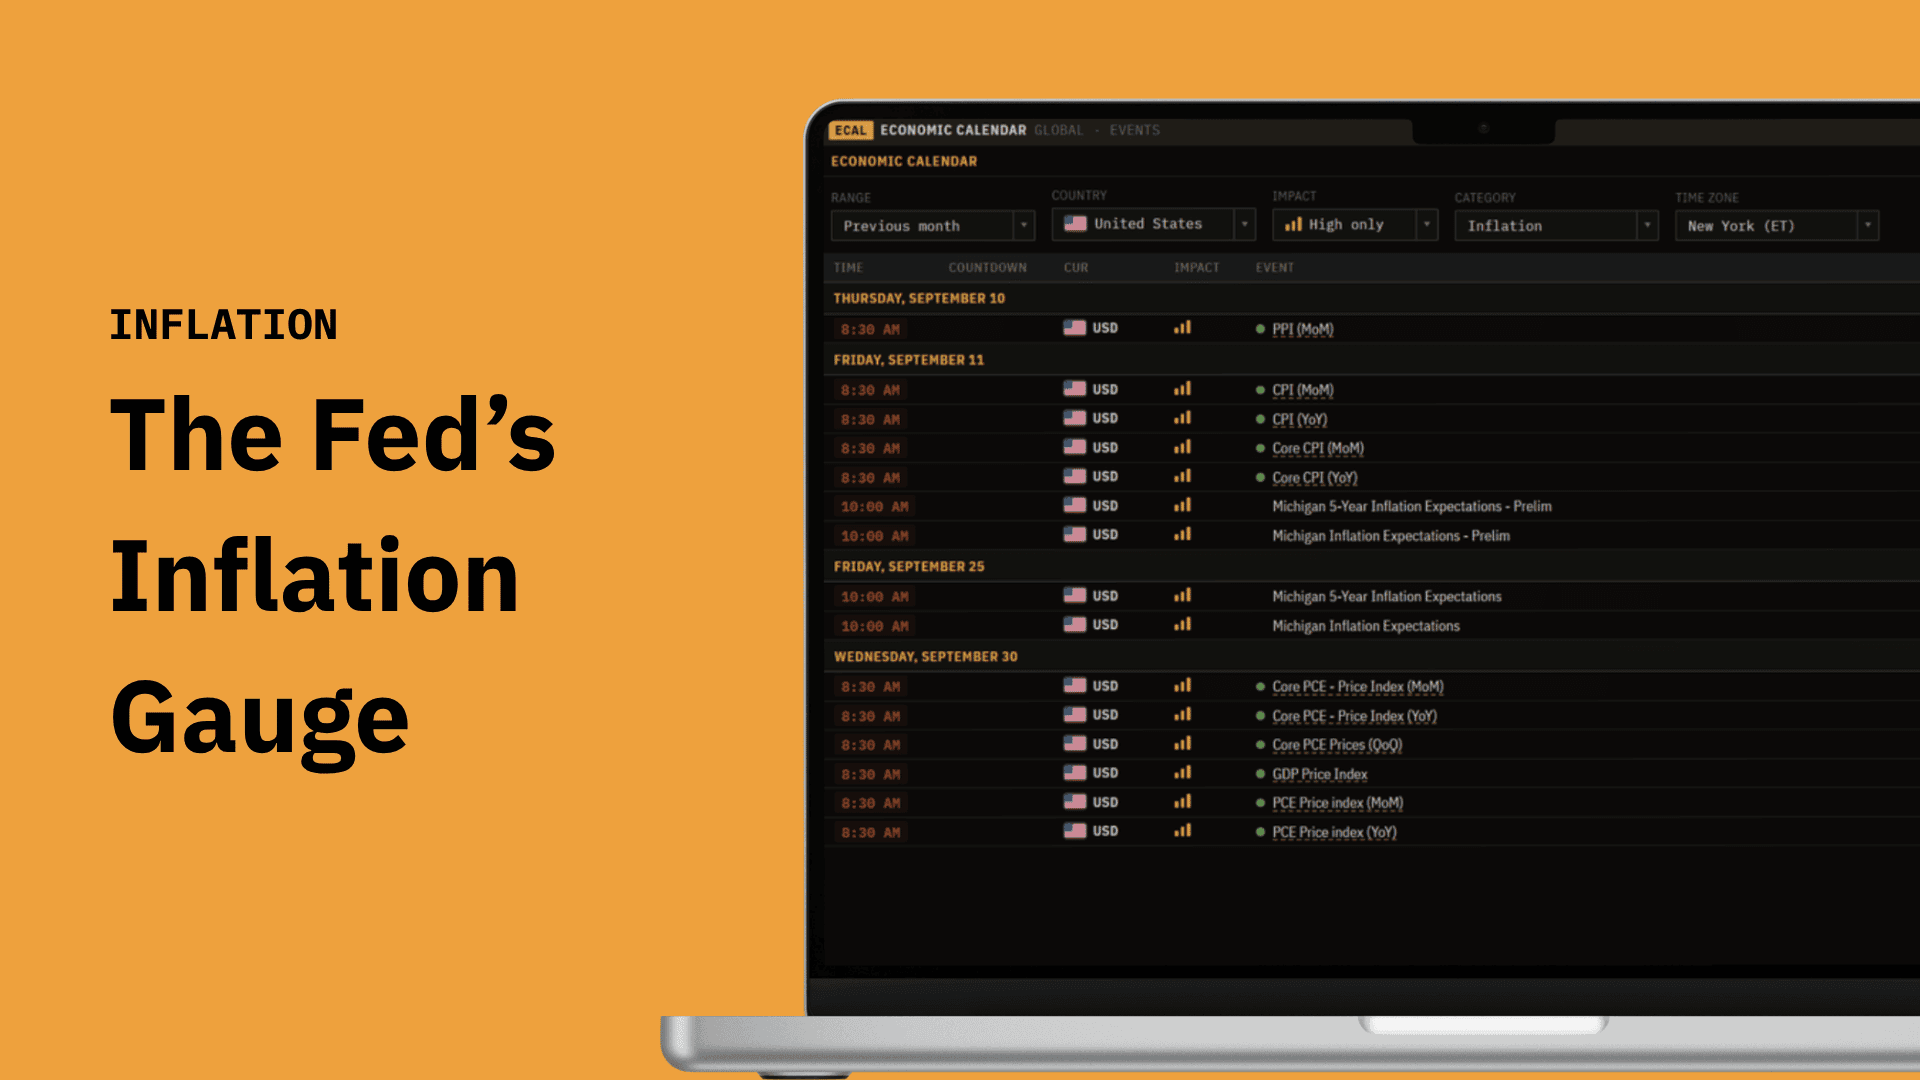
If CPI is the inflation number the market watches, PCE is the one the Federal Reserve actually targets. The Fed's 2 percent goal is measured on PCE, not CPI, so for anyone trying to read where interest rates are headed, the PCE price index is arguably the most important inflation gauge there is. It lands later and moves markets more quietly than CPI, for reasons worth understanding. Here is how to read it.
What PCE actually measures
PCE stands for Personal Consumption Expenditures, and the PCE price index tracks how much the prices of everything households consume have changed. It is published monthly by the Bureau of Economic Analysis, inside the Personal Income and Outlays report, usually about four weeks after the month ends, which makes it roughly two weeks later than the CPI for the same month.
Like CPI, you read it two ways. Month-over-month is the freshest read on momentum; year-over-year is the headline level people mean when they talk about inflation running at some percent. The Fed frames its 2 percent target in year-over-year terms, on core PCE.
Headline versus core, and the Fed's target
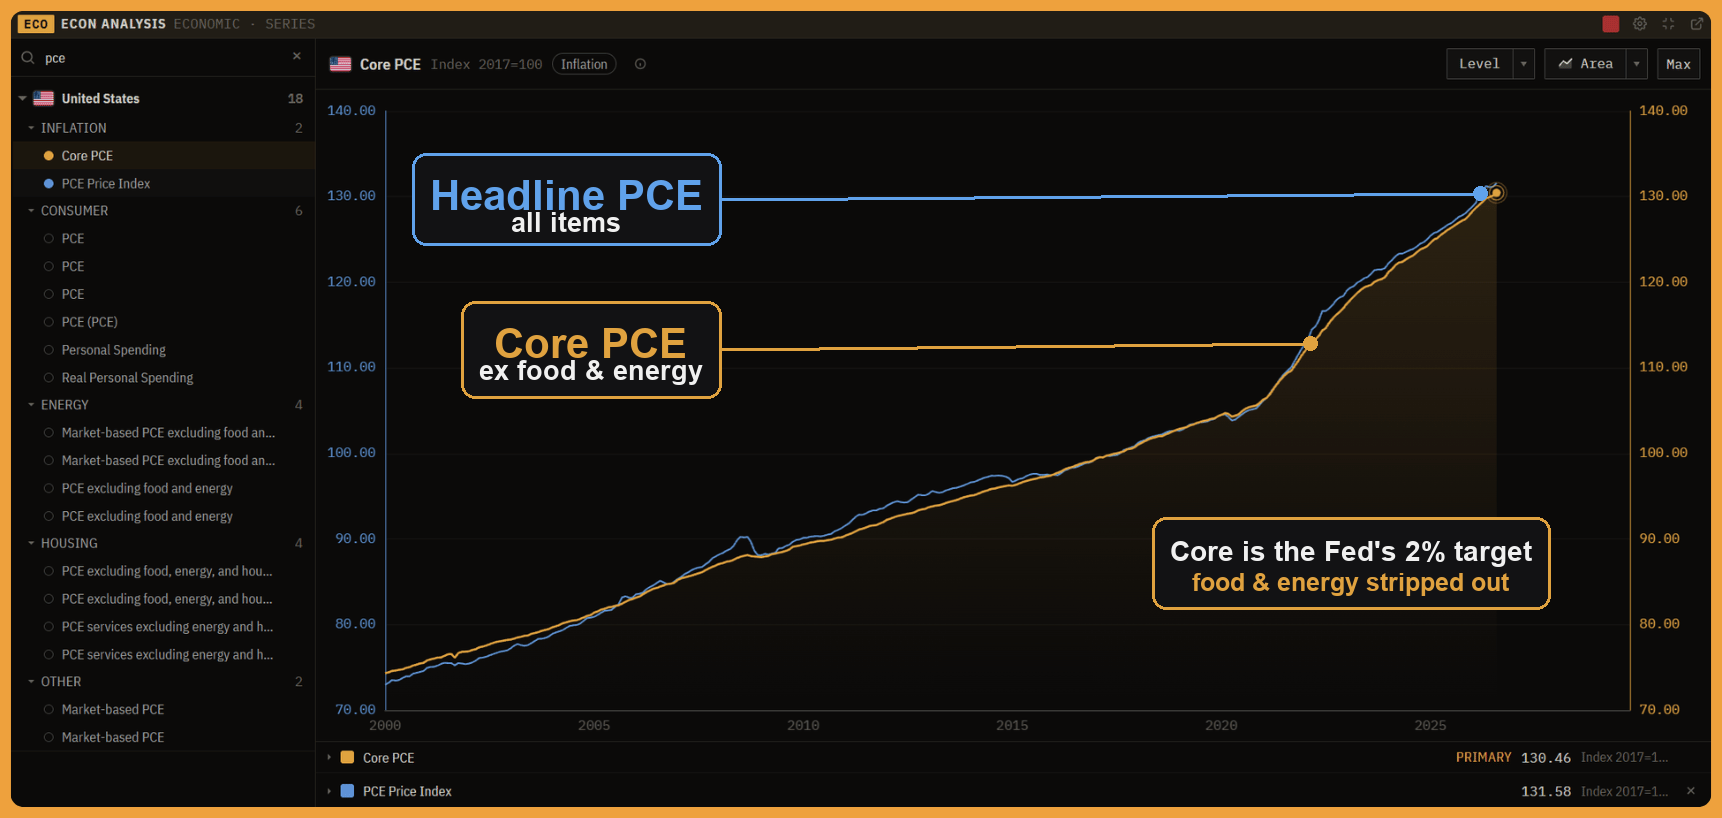
PCE comes in the same two flavors as CPI. Headline PCE includes everything. Core PCE strips out food and energy, the two categories that swing hardest on things unrelated to the underlying trend, a cold snap or an OPEC decision, and so add noise. Core is the cleaner read on where inflation is really heading.
Core PCE is the number the Fed steers by. When officials say they want inflation back to 2 percent, that is the gauge. You will also hear about "supercore," core services excluding housing, which the Fed has leaned on to judge how sticky services inflation is. But the headline target remains core PCE.
PCE versus CPI: the difference that matters
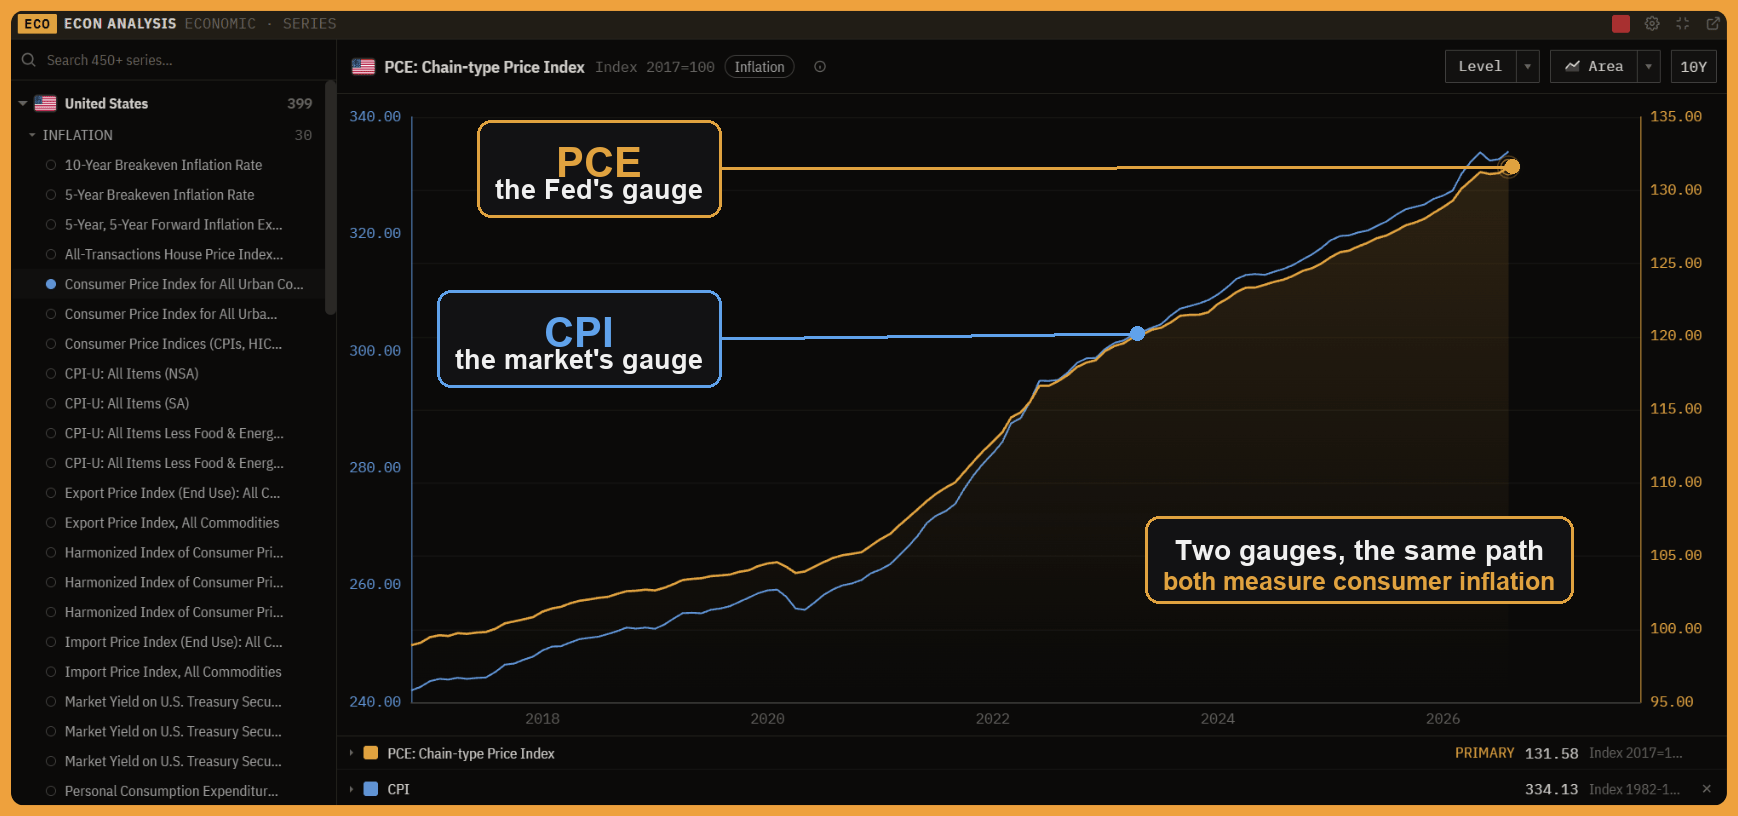
CPI and PCE measure the same thing, consumer inflation, but they disagree by a few tenths most months, and PCE almost always runs lower. Three differences explain it.
First, scope. CPI counts only what urban consumers pay out of pocket. PCE is broader: it also counts spending made on households' behalf, above all healthcare paid by employers, Medicare, and Medicaid. That gives healthcare a much larger weight in PCE and housing a much smaller one than in CPI, where rent and owners' equivalent rent make up roughly a third of the basket.
Second, the formula. PCE is chain-weighted, meaning it updates the basket to reflect substitution: when beef gets expensive and shoppers switch to chicken, PCE captures that. CPI holds its basket more fixed. Substitution consistently pulls PCE a little below CPI.
Third, because housing is lighter and healthcare heavier in PCE, the two can diverge on which category is moving. A rent-driven CPI spike shows up far smaller in PCE.
The practical takeaway: CPI is the timelier, more-watched, more-tradeable print, but PCE is the gauge policy is actually set against. A 3 percent CPI does not mean the Fed is a full point from target, because on PCE it might read closer to 2.5.
The surprise still moves markets, but often less
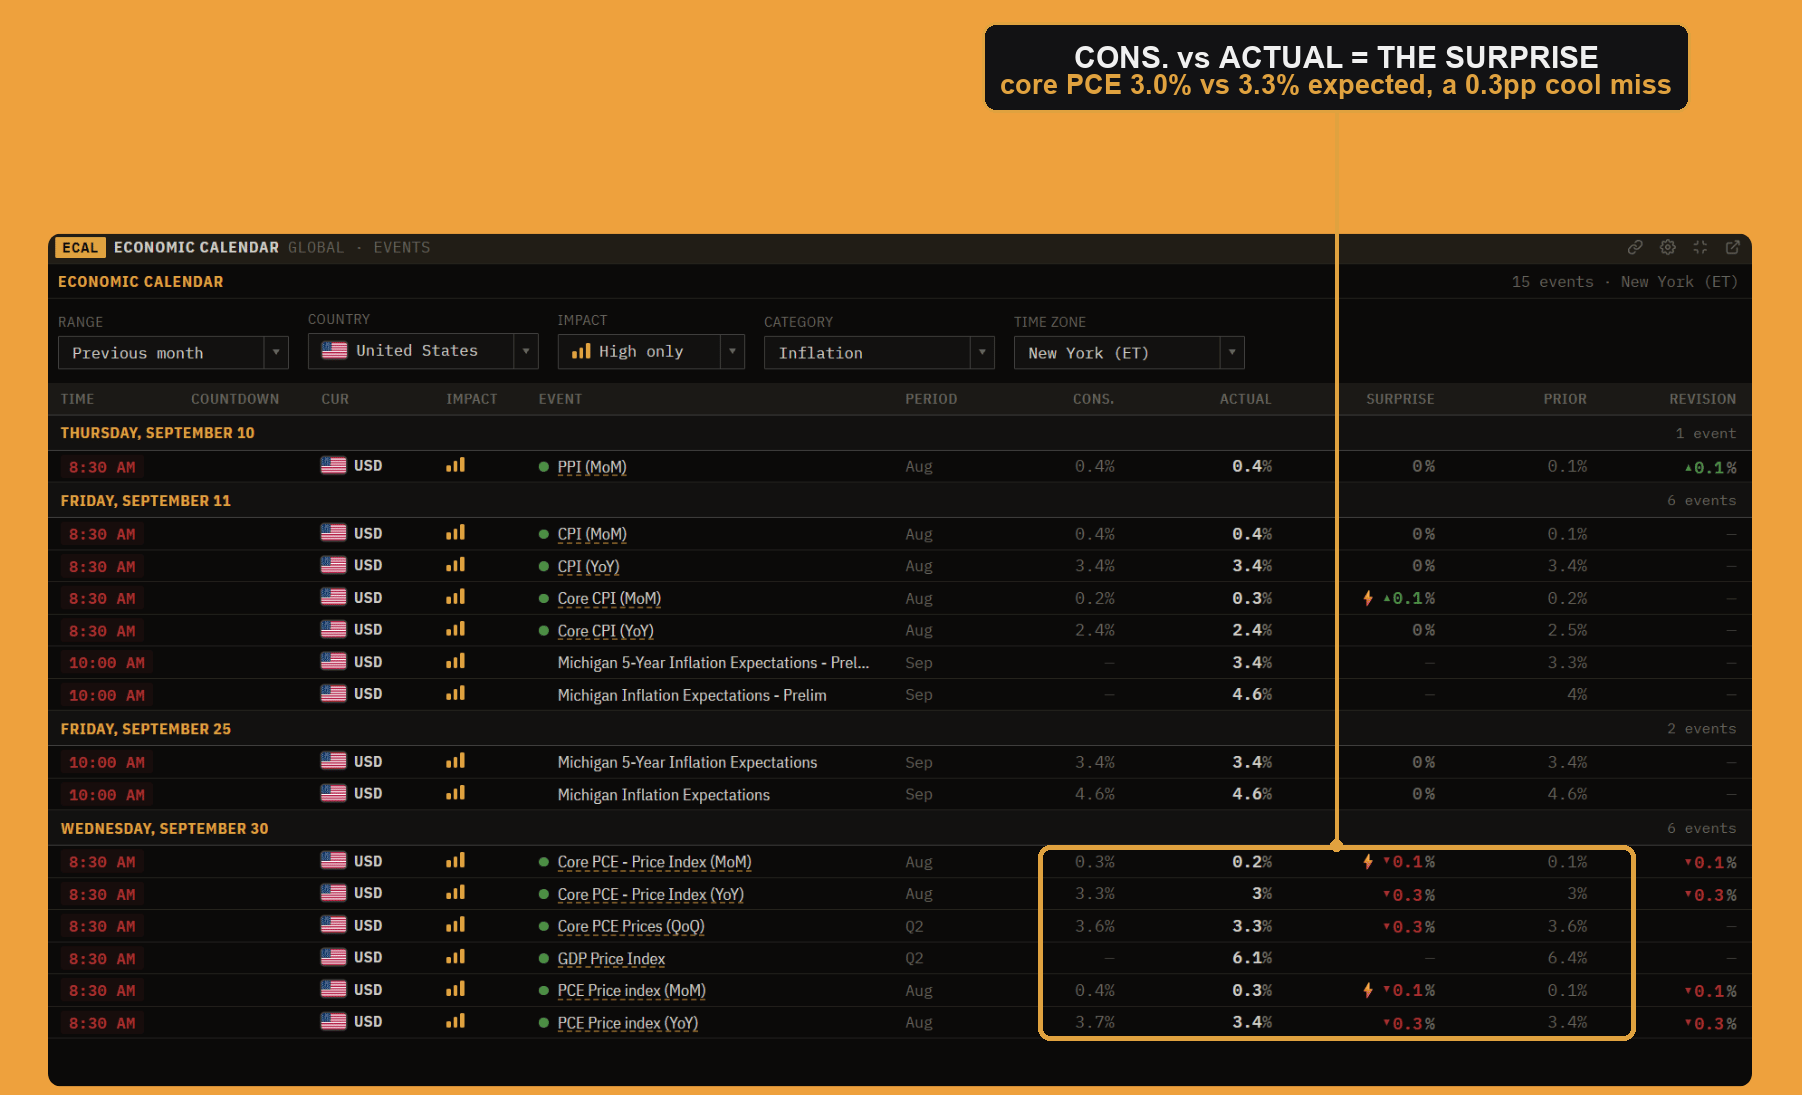
As with every release, the market does not trade the PCE number, it trades the number against the forecast. The consensus is already priced in, so the surprise, how far the actual lands from the forecast, is what moves yields, the dollar, and stocks. The calendar shows all three figures: actual, forecast, and prior.
There is a twist specific to PCE. Because it arrives two weeks after CPI, and because its components can be estimated from the already-released CPI and PPI data, desks "nowcast" core PCE with decent accuracy before it drops. By release day the surprise is usually small, so PCE day tends to be quieter than CPI day. But a genuine surprise still carries weight precisely because this is the Fed's target, so it can confirm or break the path the market expected.
What a hot or cool print does to the market
A hot core PCE, inflation above forecast, tells the market the Fed may need to keep rates higher for longer. Rate-cut bets get pushed out, short-term yields rise, bond prices fall, the dollar usually firms, and stocks often sell off, growth names most of all. A cool print does the reverse: cut bets pull forward, yields fall, and risk assets tend to rally.
This is the same machinery behind the yield curve: inflation data moves rate expectations, and rate expectations move the whole curve. Because PCE is the gauge the Fed targets, a real surprise in it speaks directly to policy.
PCE tells you the past, the market prices the future
Like CPI, PCE is backward-looking. It reports what prices did last month, while markets are forward-looking and carry their own real-time inflation forecast inside bond prices, the breakeven rate our Rates panel tracks. A PCE print matters most when it changes that forward view, confirming or breaking the trend the market already expected. An in-line print that simply ratifies the CPI read two weeks earlier often does very little.
Info: Timing is the key to the CPI and PCE relationship. CPI lands first and sets the tone; PCE lands about two weeks later and usually confirms it, because PCE is built partly from the same source data. So CPI is where the violent repricing happens, and PCE is the quieter, official follow-up the Fed actually logs against its 2 percent target.
PCE around the world
Here PCE is the odd one out. The idea of targeting a broad consumption-expenditure deflator instead of a consumer price index is largely a U.S. practice. Most other major central banks target a CPI-type measure directly: the European Central Bank aims at the euro area's HICP, the Bank of England at UK CPI, and others at their own national CPI. So while every economy has an equivalent of CPI, the "preferred gauge is PCE" distinction is specific to the Federal Reserve.
That is worth knowing as a trader, because it tells you which release to watch for each central bank. For the Fed, core PCE is the target but CPI is the mover; for the ECB and the Bank of England, the CPI-type print is both. Our economic calendar carries the inflation releases for every economy under the Inflation category, so you can line the U.S. PCE and CPI up against euro area HICP and the rest.
How to read it like a desk
Put it together and a PCE release takes seconds to read. Check core against its forecast first, that is the signal. Note the direction and size of the surprise, and remember it is usually small because the print was half-knowable from CPI and PPI already. Then place it against the trend: is this confirming the cooling path CPI implied two weeks ago, or breaking it? Because this is the Fed's gauge, a real break matters more than the muted release-day reaction suggests.
Warning: One print is noise, and PCE is revised, often meaningfully, as the BEA folds in later source data. A single month, hot or cool, can be walked back. Trade the trend in core, not a lone headline, and remember the reaction is about the surprise versus expectations, not the absolute level.
The bottom line
PCE is the inflation gauge the Fed actually targets, which makes core PCE the number that most directly speaks to the path of interest rates. It runs a few tenths below CPI, lands about two weeks later, and usually moves markets less on the day because it is already half-priced from CPI and PPI. Read core over headline, the surprise over the level, and the trend over any single month, and treat PCE as the Fed's official scorecard confirming the story CPI told first.