Research
CBCentral Bank
The Fed on one screen: the decision clock and market-implied odds, a redline of what the statement changed, the FOMC committee by stance and vote, the dot plot, and a live Fed news tape.
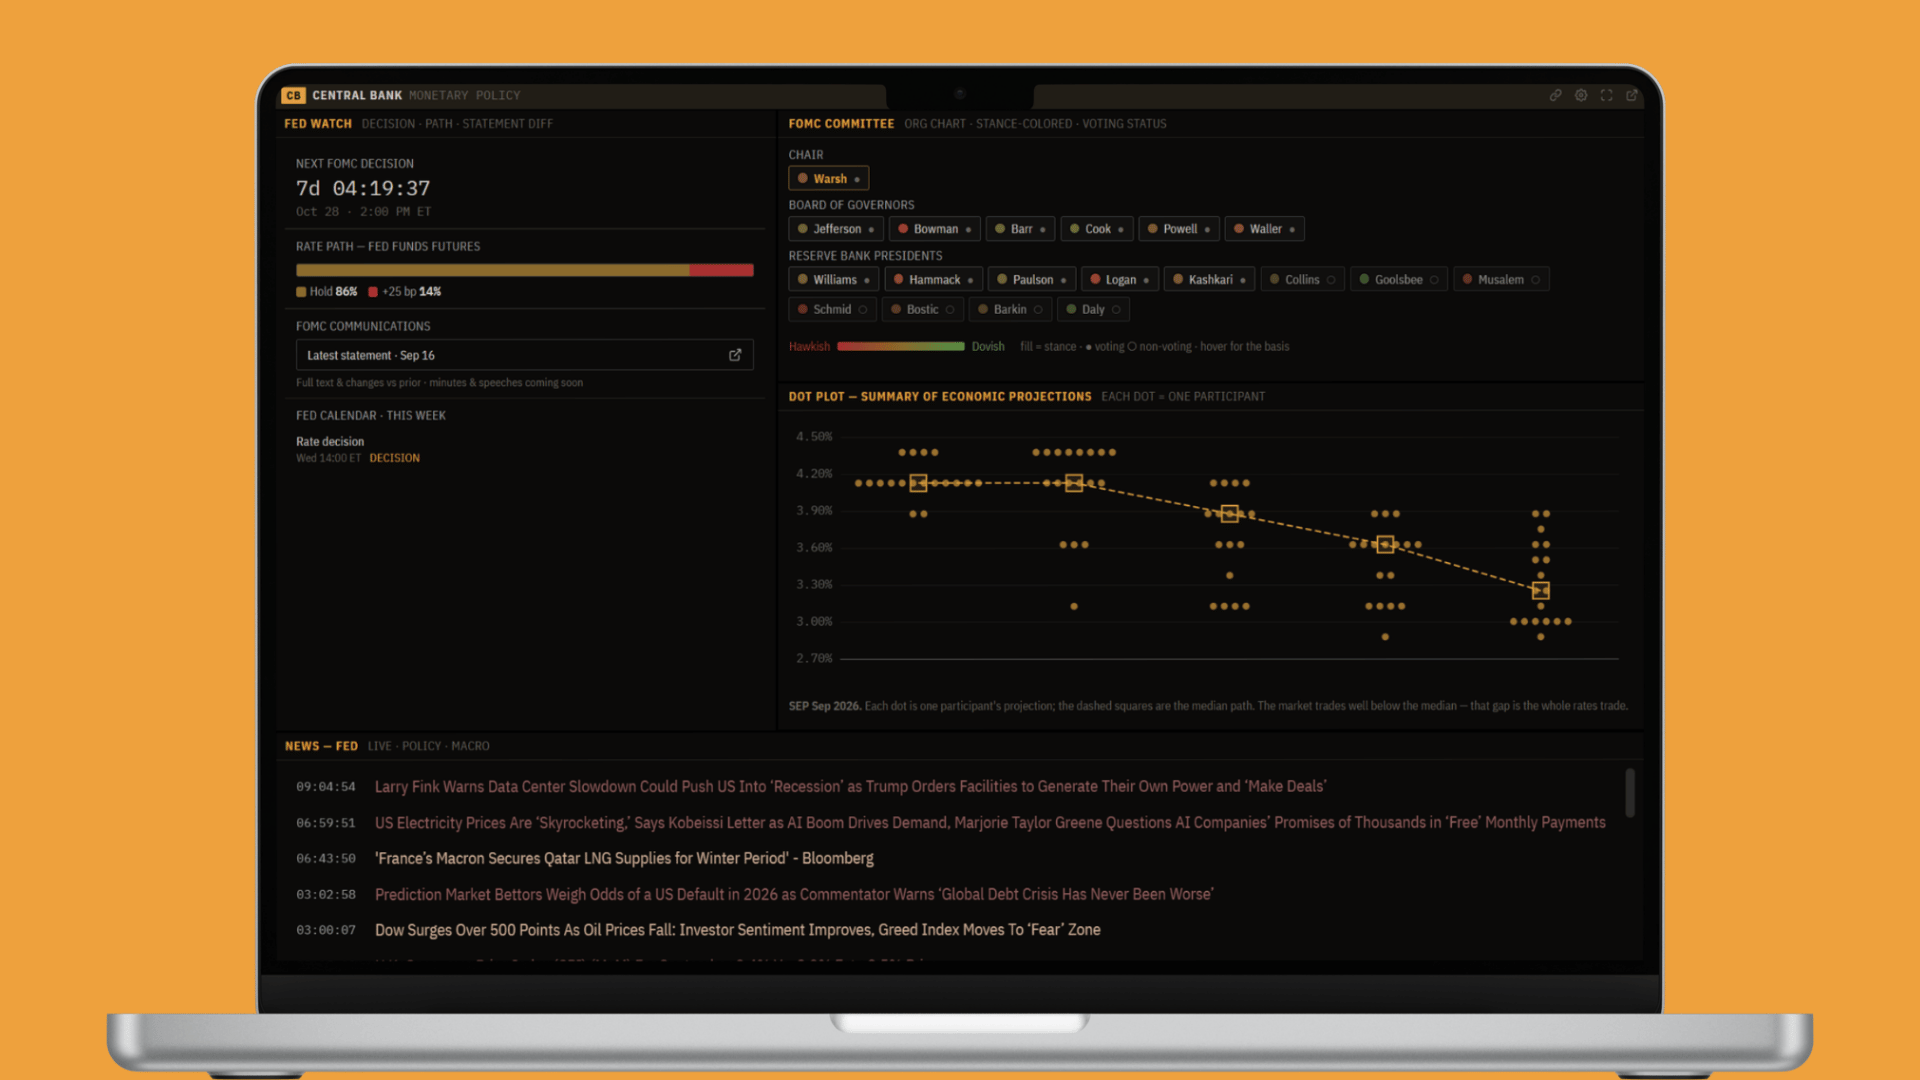
One institution moves more markets than any other, and it does it with words. The Federal Reserve sets the price of money, and a single sentence in its statement, or a shift in one official's tone, can reprice every asset there is. This panel is the Fed on one screen: when the next decision lands and what the market expects, exactly what the last statement changed, who is in the room and how they lean, where they project rates going, and the headlines moving it all. It turns "Fed day" from a scramble across a dozen sources into one worksheet.
Why this panel exists
Trading the Fed means holding several things in your head at once: the schedule, the market-implied odds, the exact language of the statement and how it changed, the voting lineup and each member's lean, and the projections in the dot plot. That information is scattered, the statement on one site, the futures-implied odds on another, the dot plot in a PDF, the committee roster somewhere else, and most of it only matters in relation to the rest. This panel pulls it together so the question becomes "what is the Fed doing, and what is priced?" instead of a frantic hunt the moment a statement drops.
Note: This is end-of-day and event-driven data (the statement, the dot plot, futures-implied odds), not a tick-by-tick live feed. Read it as today's picture of Fed policy.
Fed Watch
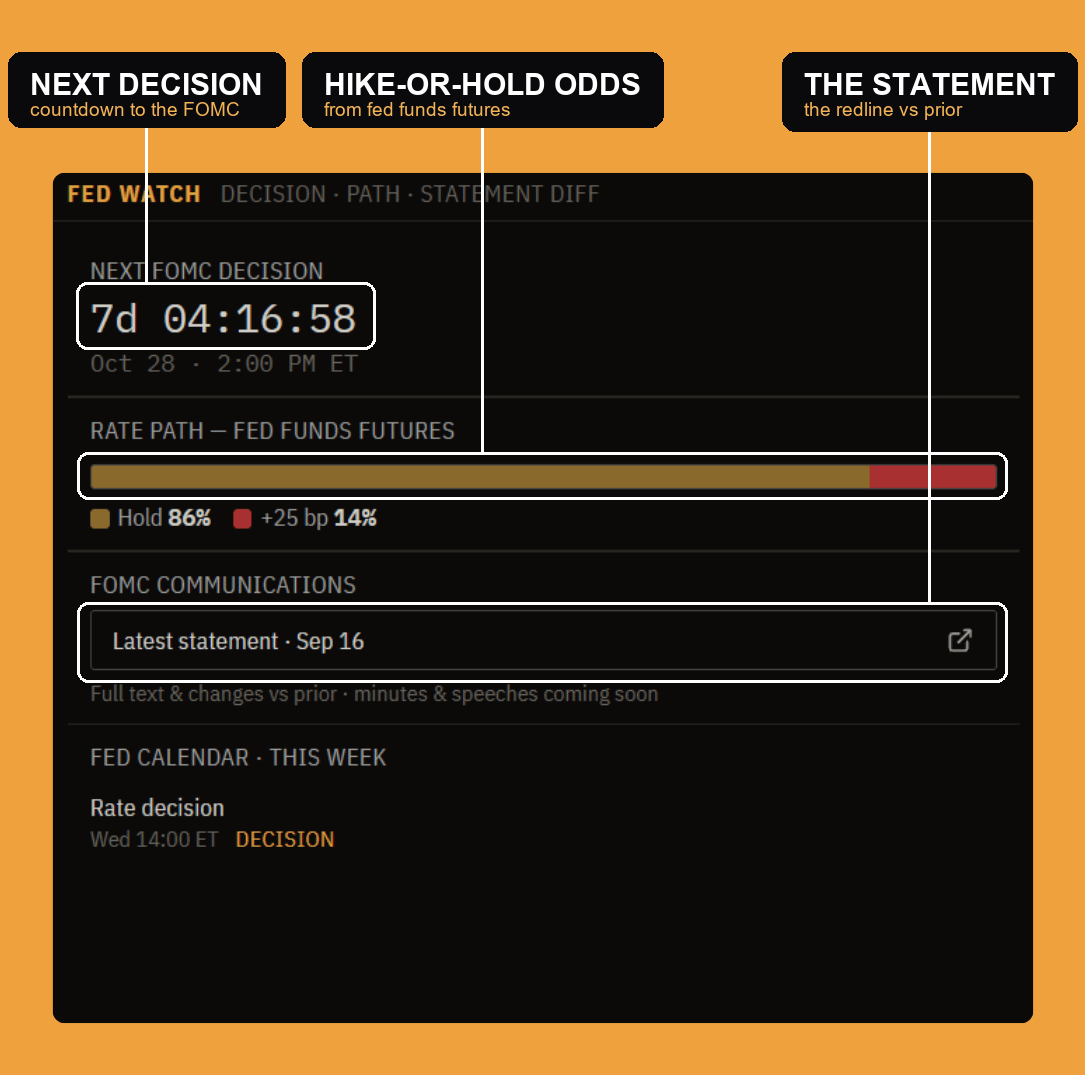
Fed Watch is the decision at a glance. A countdown ticks down to the next FOMC decision with its exact date and time. The rate path reads the market-implied odds straight off fed funds futures, the probability the market assigns to a hold versus a hike (or cut) at that meeting, so you see what is already priced before you form a view. FOMC communications links to the latest statement (and its redline, below), and the Fed calendar flags the week's policy events. It is the "when, and what is expected" that frames everything else.
The statement diff
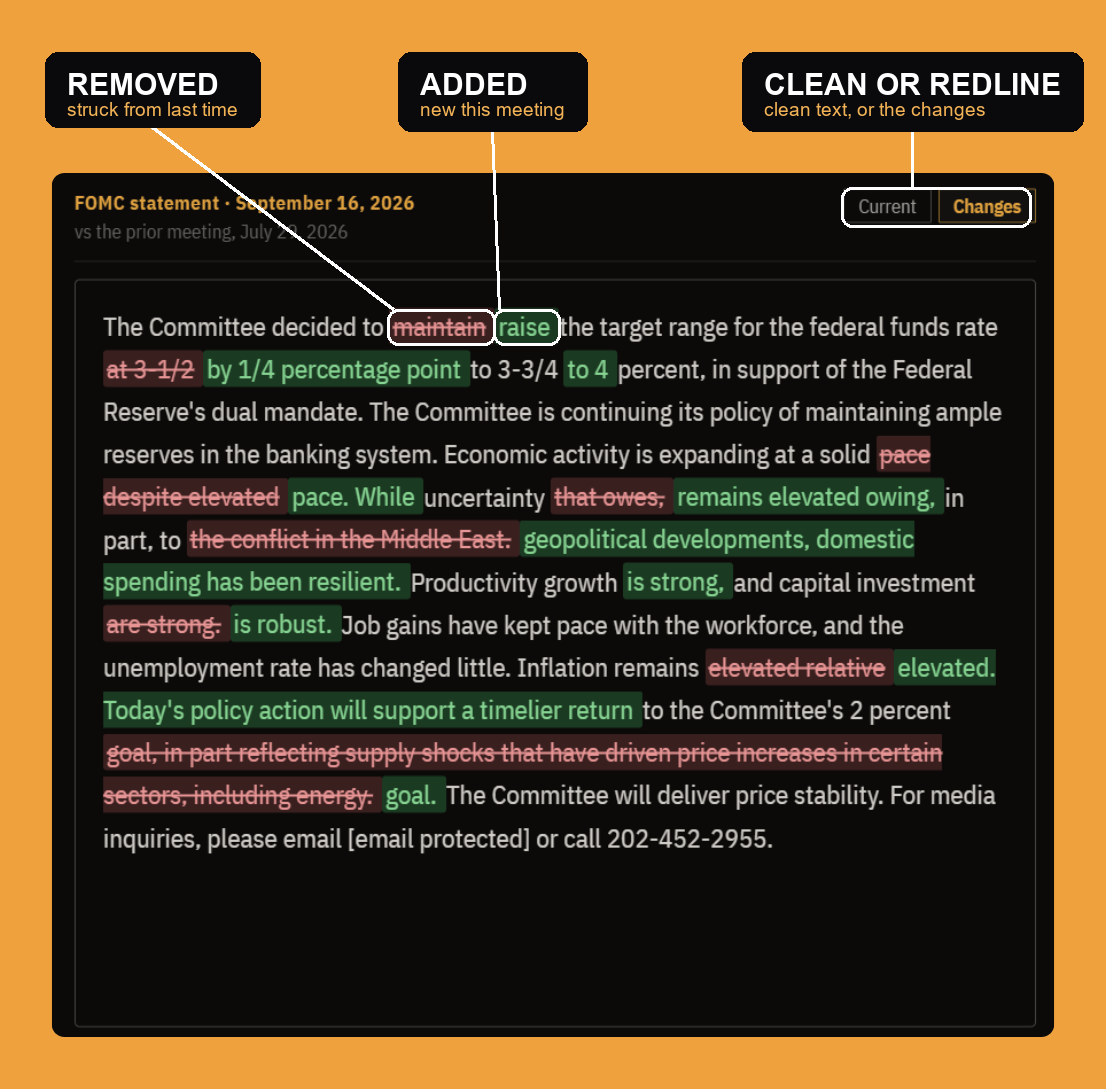
The Fed barely rewrites its statement meeting to meeting, so the changes are the message, and this is where they jump out. Toggle from the clean current text to changes, and the statement is shown as a redline against the prior meeting: removed language struck through in red, new language highlighted in green. A one-word edit, "maintain" becoming "raise," "solid pace" becoming "despite elevated uncertainty," is exactly what the market trades, and here it reads in seconds instead of diffing two PDFs by hand.
The FOMC committee
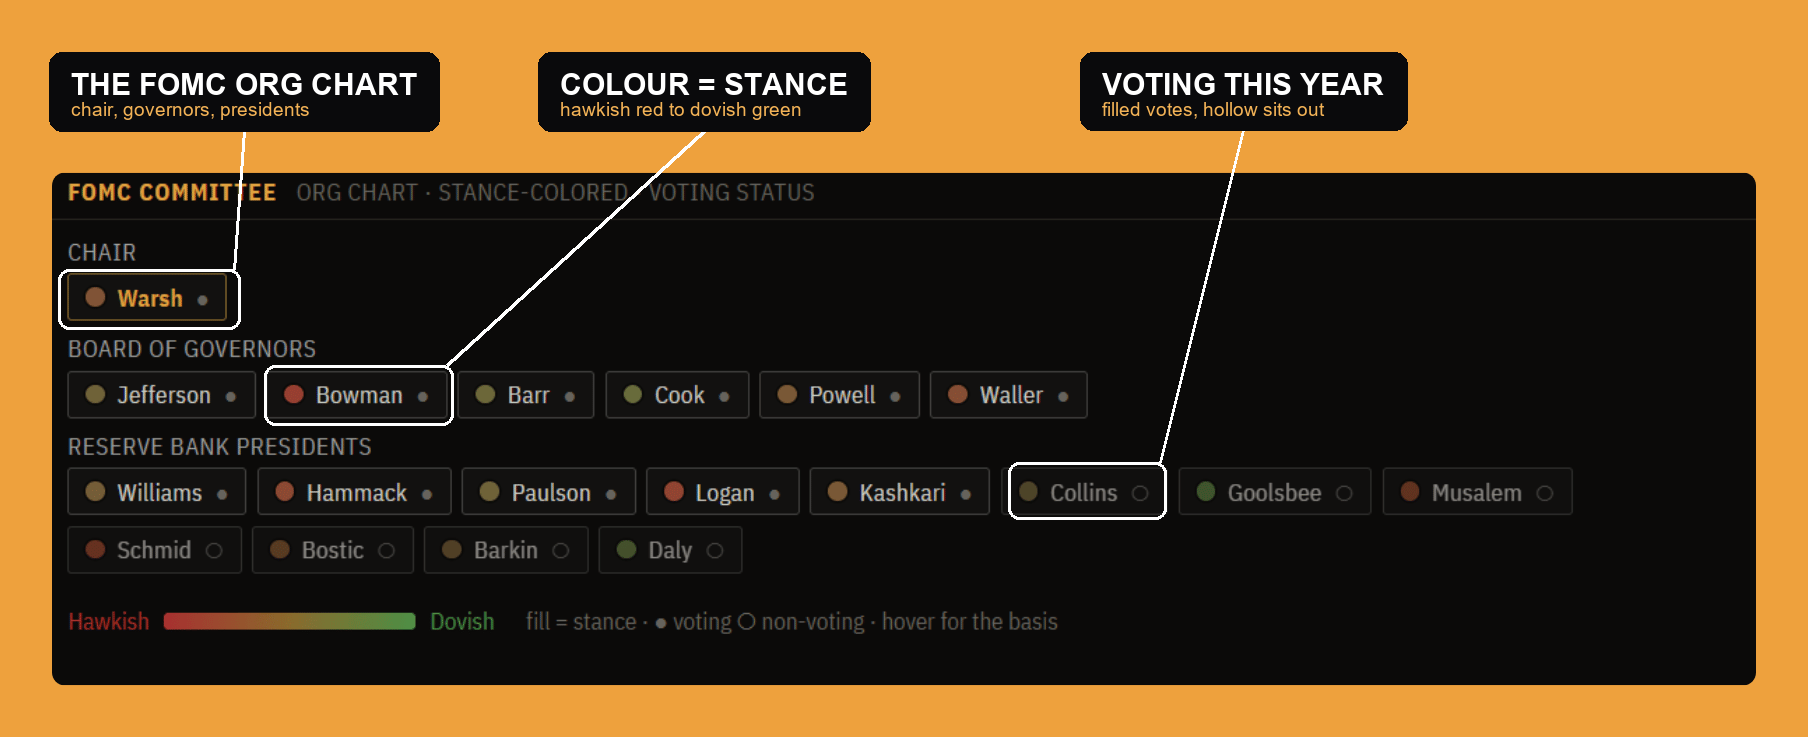
Policy is set by people, and this is the room, laid out as an org chart: the Chair, the Board of Governors, and the Reserve Bank presidents. Two things are encoded on every name. The color is stance, on a scale from hawkish (red) to dovish (green), so you can read the committee's lean at a glance. And each member is shown as a voting member this year (a solid dot) or non-voting (a hollow one), because the Fed's voting seats rotate, and only the votes count on decision day. Together they answer "which way does this committee lean, and who actually gets a say right now?"
The dot plot
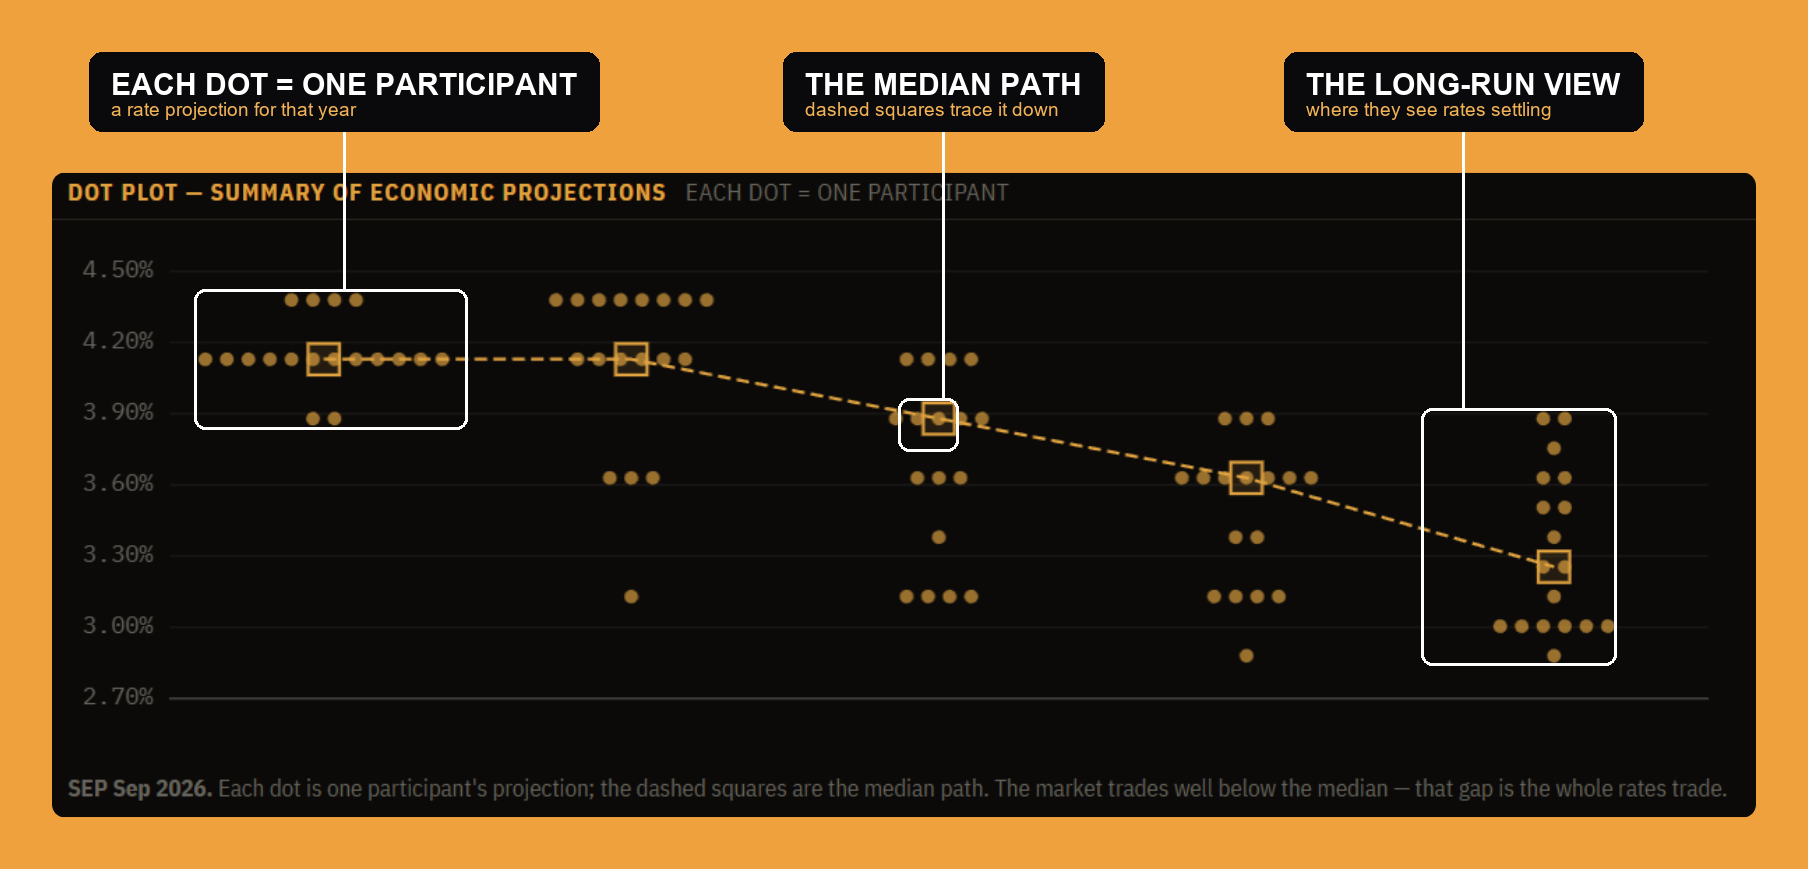
Four times a year the Fed publishes its Summary of Economic Projections, and the famous "dot plot" is the heart of it: each dot is one participant's projection for where the policy rate should be at the end of each year and in the longer run. The dashed squares trace the median path, the committee's central projection, which typically falls over time as they pencil in cuts. Two things matter when you read it: the spread within each year (wide dots mean little agreement), and the gap between the median and where the market is pricing, because that gap, the Fed's projection versus the market's bet, is often the whole trade.
Fed news
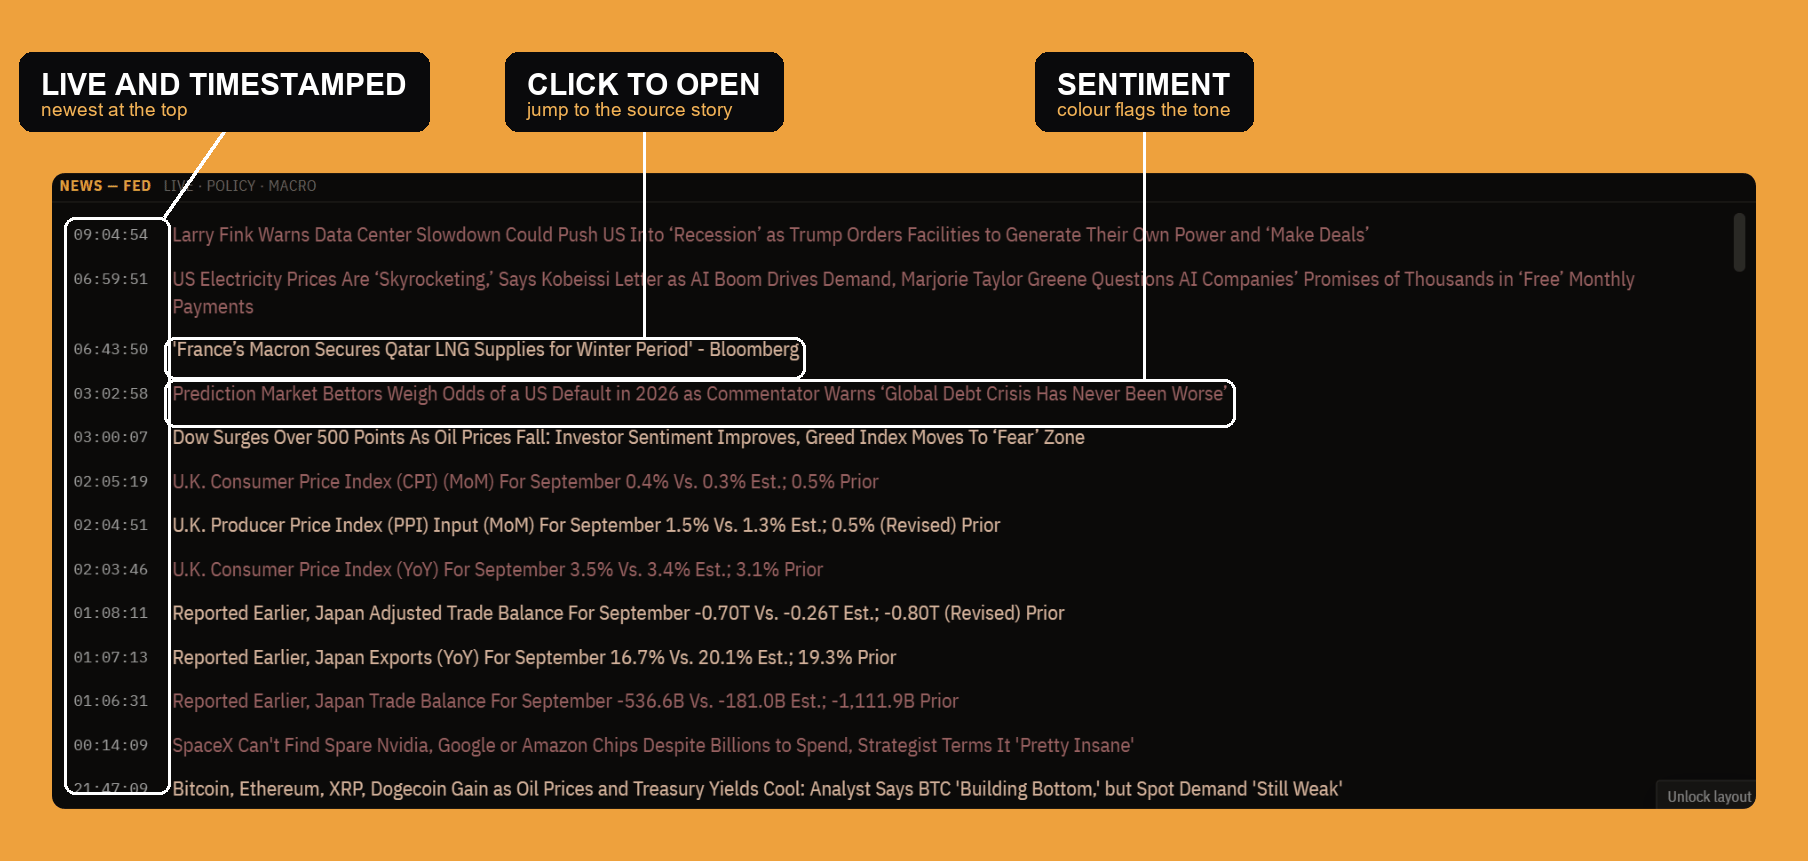
The bottom of the panel is a live headline tape filtered to the Fed, policy, and macro, so Fedspeak, data surprises, and policy news sit right next to the decision clock and the statement above them. It keeps the running commentary next to the numbers, the "why" alongside the "what."
Settings
Like the other research panels, Central Bank is configurable from the gear in the top-right (or by right-clicking the window), with a settings list, one section per piece of the panel.
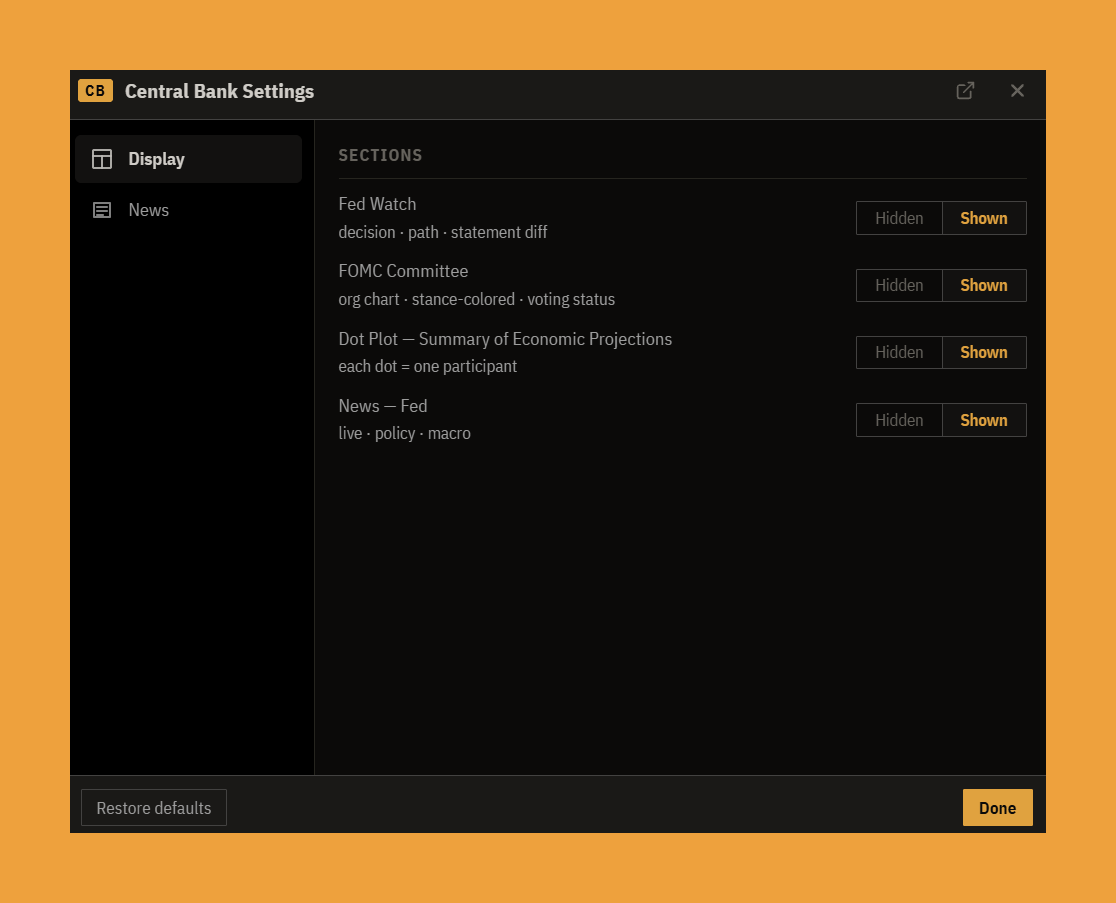
- Display is the show/hide list: turn Fed Watch, the FOMC committee, the dot plot, or the news on or off to keep only the parts you use.
- News tunes the tape: an importance filter sets the floor so you see only headlines at a chosen tier and up, and row-field toggles decide what each headline shows (the source, the time and date, the importance meter, and a sentiment stripe or chip), plus whether a headline opens its source on click.
The bottom line
The Central Bank panel is built to read the Fed the way the market does: start with the clock and the odds (Fed Watch), see exactly what the statement changed (the redline), read who is in the room and how they lean (the committee), check where they project rates going (the dot plot), and keep the news running alongside. The whole point is the last one: the Fed's projection against the market's price. When you can see both at once, Fed day stops being a scramble and becomes a single, legible picture.