Research
MTLMetals
Precious and base metals on one screen: a gold-to-copper price board, miner margins, the gold forward curve, CFTC positioning, LME and COMEX inventories, the macro calendar, the mining equity complex, and a live metals tape.
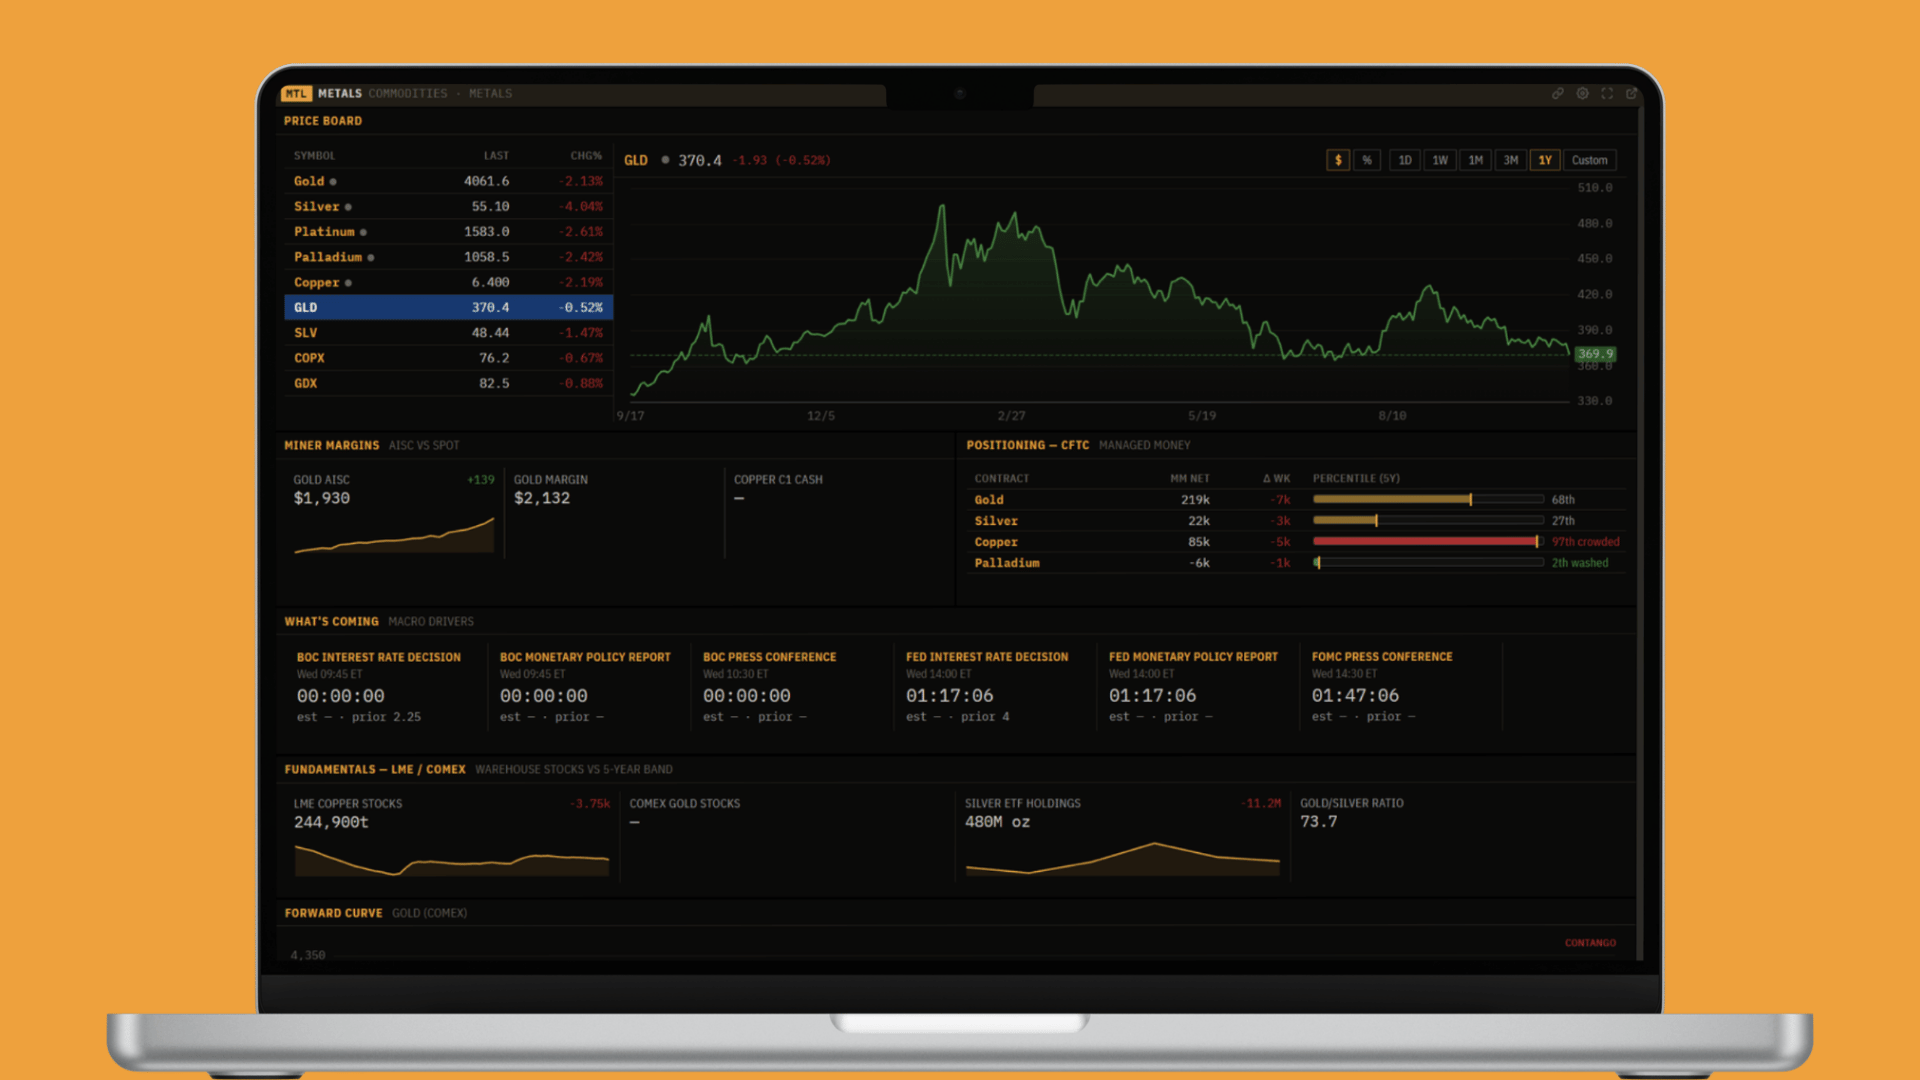
Metals are two markets wearing one coat. Precious metals, gold and silver, trade on real yields, the dollar, and fear, the monetary side of the market. Base metals, led by copper, trade on growth: factories, construction, the power grid, and electric vehicles. This panel puts both on one screen: the prices, what it costs the miners to dig it up, what the futures curve and the positioning say, how much metal sits in the warehouses, and which stocks it all moves. It is the metals desk, from the bar to the miner to the macro.
Why this panel exists
A metals trader is reading several markets that do not share a dashboard: spot gold and silver, the base-metals complex, the mining cost curve, the CFTC positioning report, the LME and COMEX warehouse data, and the central-bank calendar that drives the dollar and real yields underneath it all. Each lives somewhere different and updates on its own clock. This panel gathers them so the question becomes "what are metals telling me today?", the price, the margin, the curve, the positioning, and the fundamentals, read together instead of chased down one report at a time.
Note: This is end-of-day and weekly data (prices, the curve, CFTC, LME/COMEX), not a tick-by-tick live feed. Read it as today's picture of the metals market.
The price board
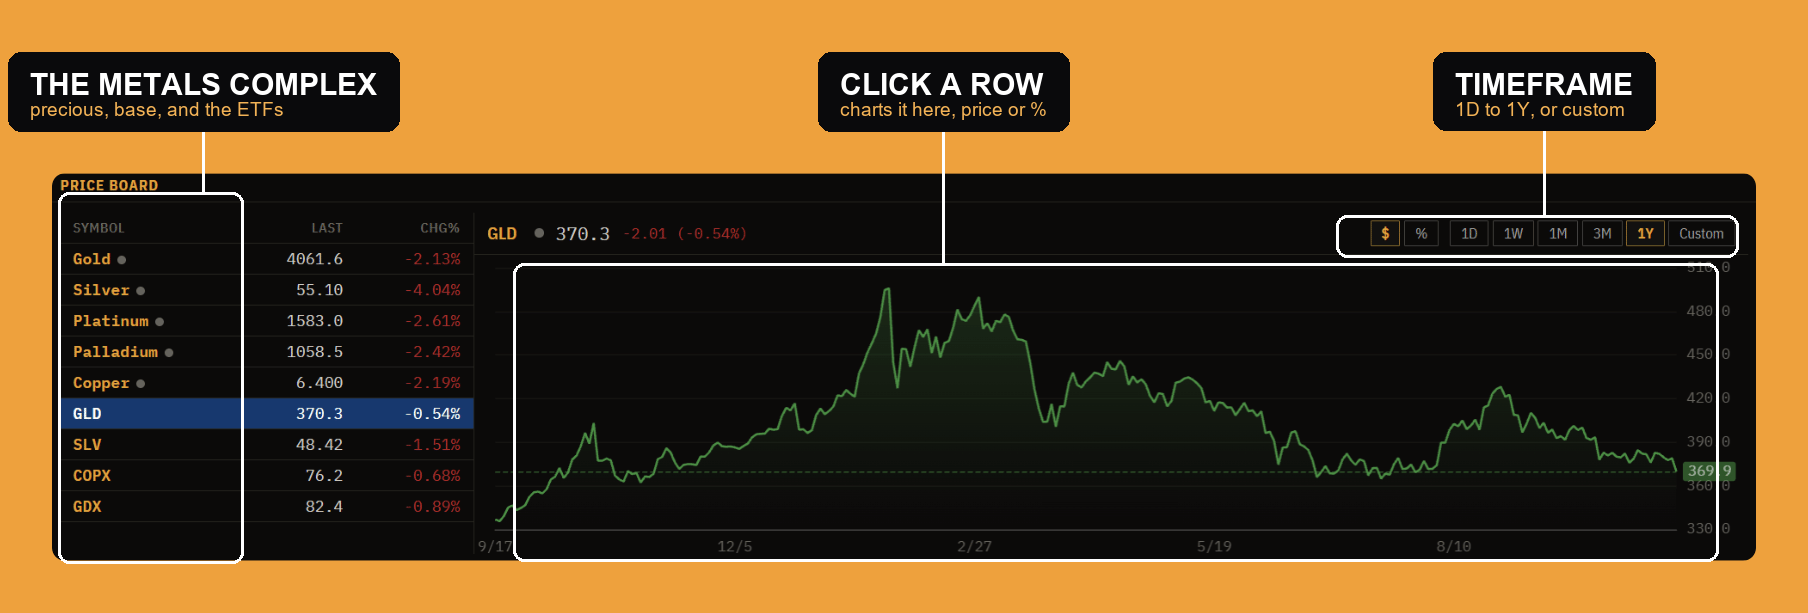
The board is the whole complex top to bottom: the precious metals (Gold, Silver, Platinum, Palladium), the key base metal (Copper), and the tradeable ETFs (GLD, SLV, COPX, GDX). Each row shows the last price and the day's percent change. Click any row and the chart on the right plots that instrument's history; the toggles switch between price and percent and the time window (1D through 1Y, or a custom range). It is the one place to watch gold, silver, copper, and the mining ETFs move together.
Miner margins
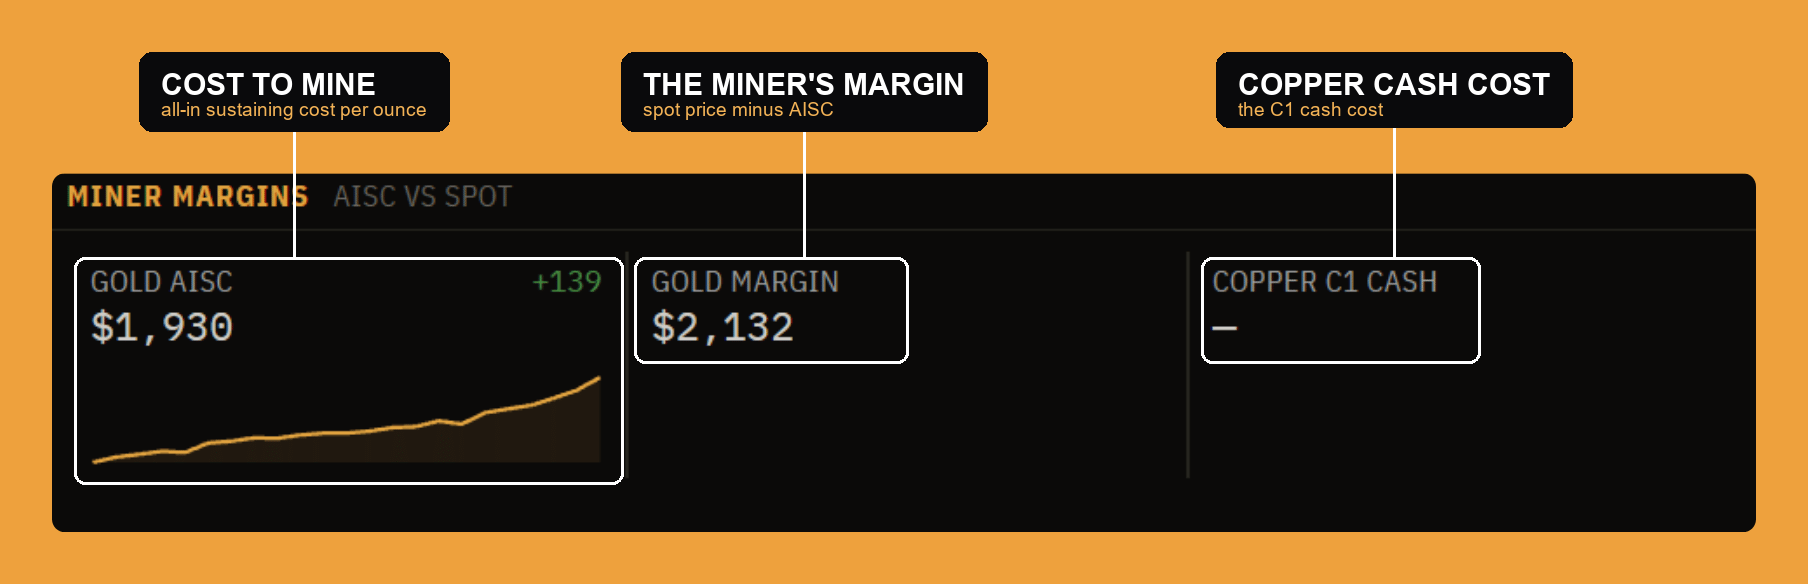
A mining stock is a leveraged bet on the metal, and this block shows why. AISC is the all-in sustaining cost, the full cost to produce one ounce of gold, and the gold margin is simply the spot price minus that cost. Because the cost moves slowly while the metal can jump, a rise in gold drops almost entirely through to the margin, which is why the miners move more than the metal. The copper C1 cash cost is the same idea for copper. When spot runs ahead of a flat cost line, the whole mining complex re-rates.
The forward curve
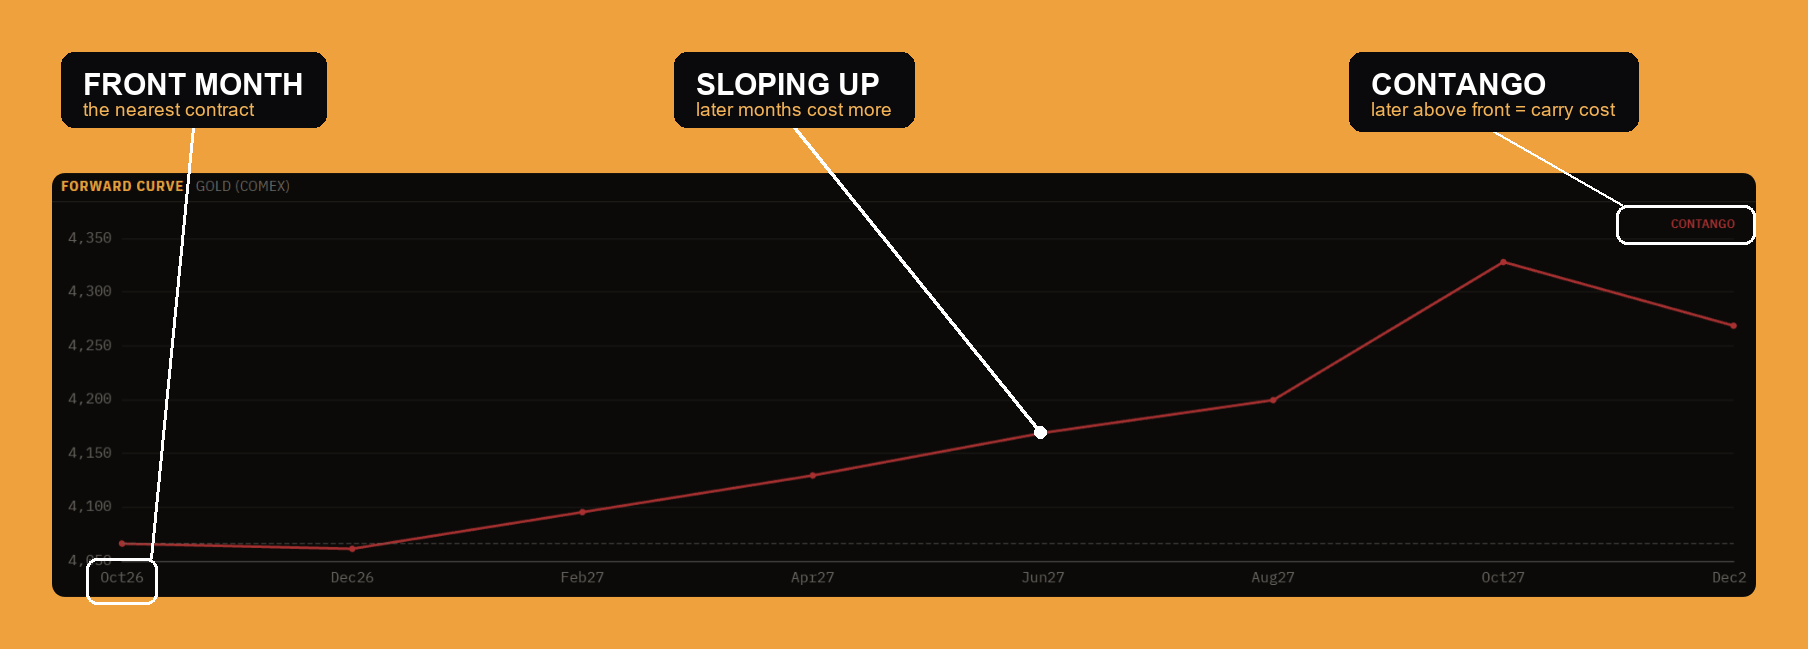
The forward curve plots COMEX gold futures by delivery month, and for gold the normal shape is contango: later months priced above the front (the panel labels it). That upward slope is the cost of carry, the storage and interest cost of holding metal over time, and it is the baseline for gold because, unlike oil, gold is not consumed. When the curve flattens or flips to backwardation (front above later), it signals unusual physical tightness, metal wanted now. The front point is the nearest contract; the slope from there is the carry story.
CFTC positioning
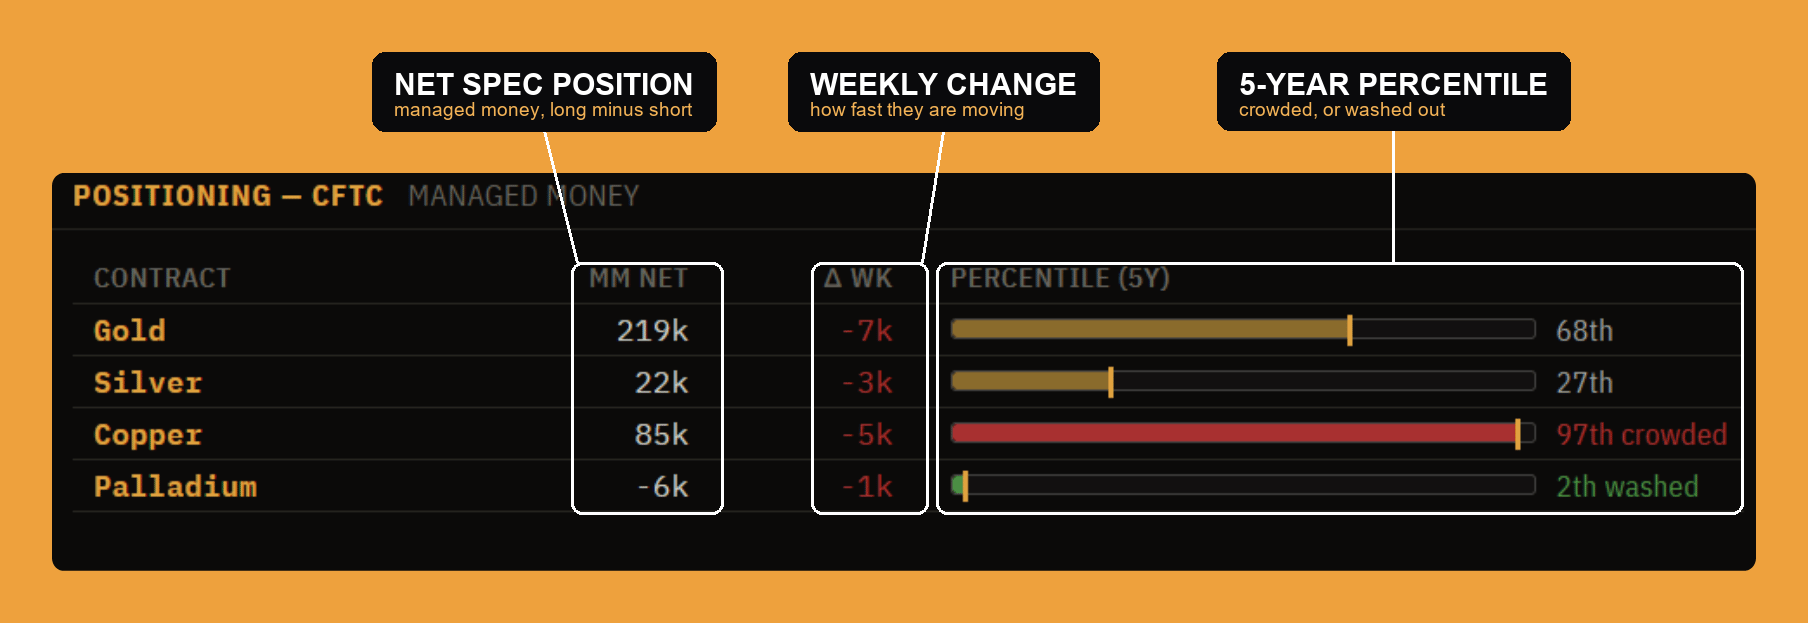
The Commitments of Traders report shows how the big speculators are leaning. This block reads the managed money category (the trend-following funds) for each metal: the net position (long minus short), the weekly change (how fast they are adding or cutting), and a five-year percentile that flags whether the position is crowded or washed out. The extremes are the tell: a metal everyone is already long (high percentile, "crowded") has few buyers left, and a washed-out reading is often where the next move begins.
LME / COMEX fundamentals
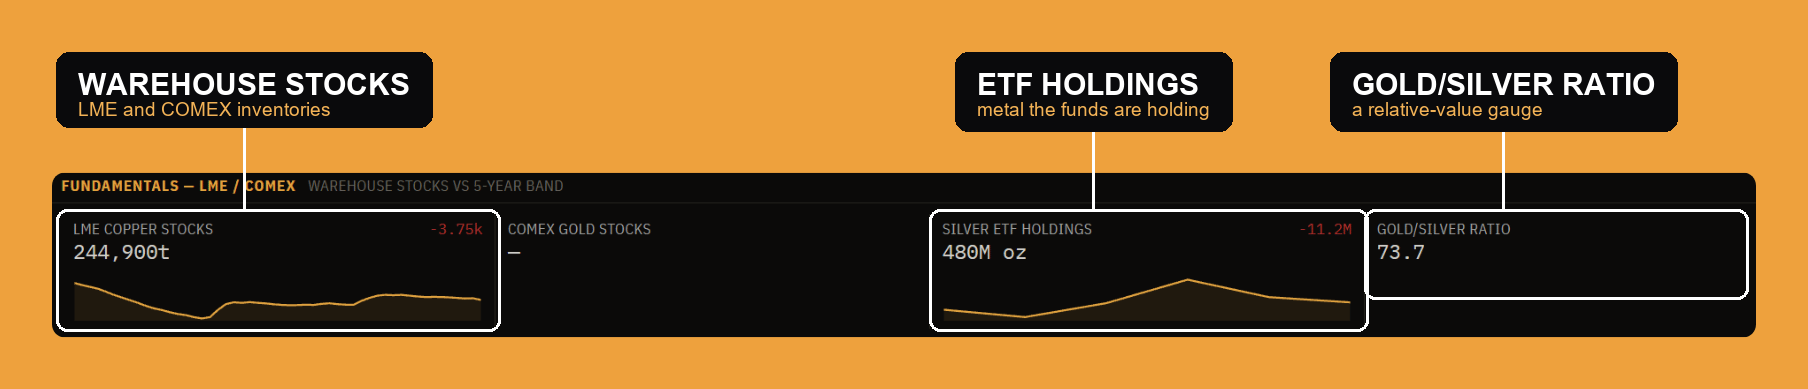
Price is set at the margin by physical metal, and this is where it sits: LME copper stocks and COMEX gold stocks (the exchange warehouses), silver ETF holdings (metal locked up in the funds), and the gold/silver ratio. Each level is shown against its 5-year band, so a draw reads as tight or loose against what is normal. Falling warehouse stocks mean a tightening physical market; the gold/silver ratio (how many ounces of silver buy one ounce of gold) is the classic relative-value gauge, high when fear dominates, low when silver's industrial side is in demand.
What's coming
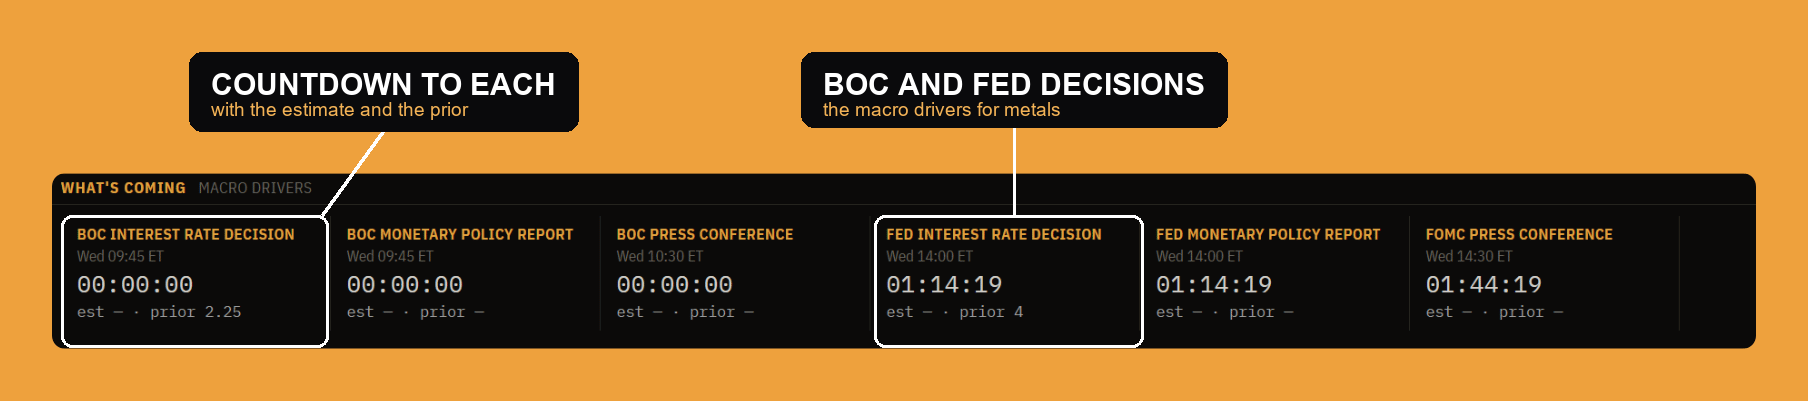
Metals, especially gold, trade off the dollar and real yields, so the events that matter most are central-bank decisions. This calendar counts down to them, the Bank of Canada and the Fed rate decisions, policy reports, and press conferences, each with its scheduled time and, where available, the estimate and the prior. It is the "what moves the macro" that sits next to the price: a hawkish surprise lifts real yields and pressures gold, a dovish one does the opposite.
The equity complex
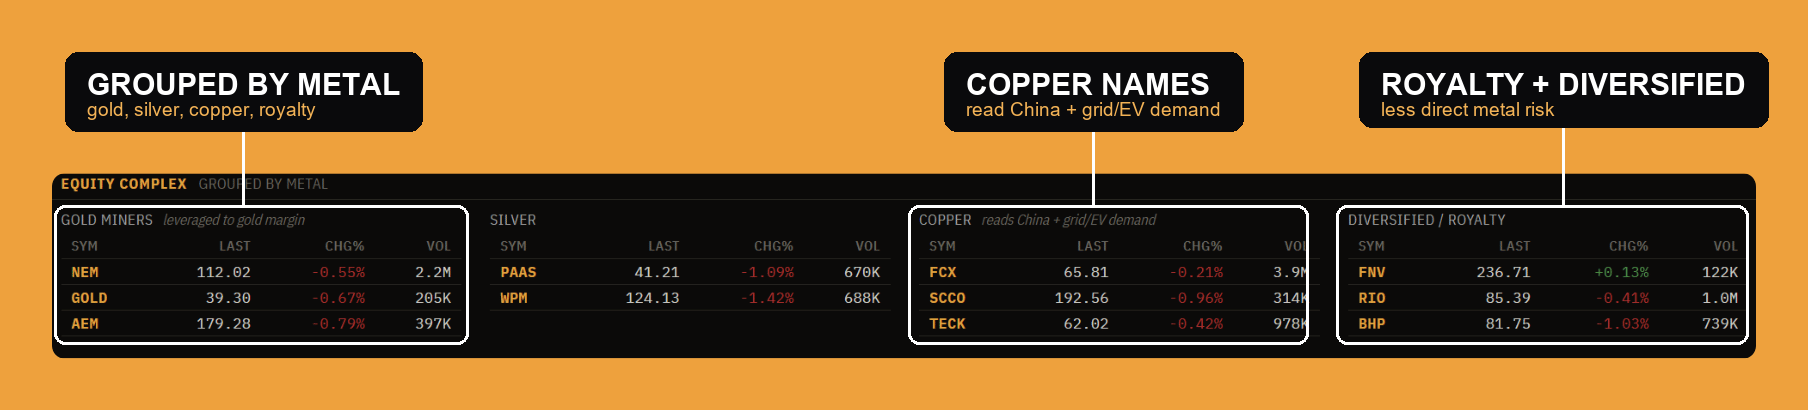
The miners do not all trade on the same thing, so the equity complex is grouped by metal. Gold miners (NEM, GOLD, AEM) are leveraged to the gold margin, they amplify the metal. Silver names (PAAS, WPM) ride silver's mix of precious and industrial demand. Copper names (FCX, SCCO, TECK) are really a bet on China and grid/EV demand, copper is the economy's metal. And diversified and royalty companies (FNV, RIO, BHP) carry less direct metal risk, spread across commodities or earning a cut without operating the mine. Grouping them this way turns a move in a metal into a clear read on which stocks it lifts.
Metals news
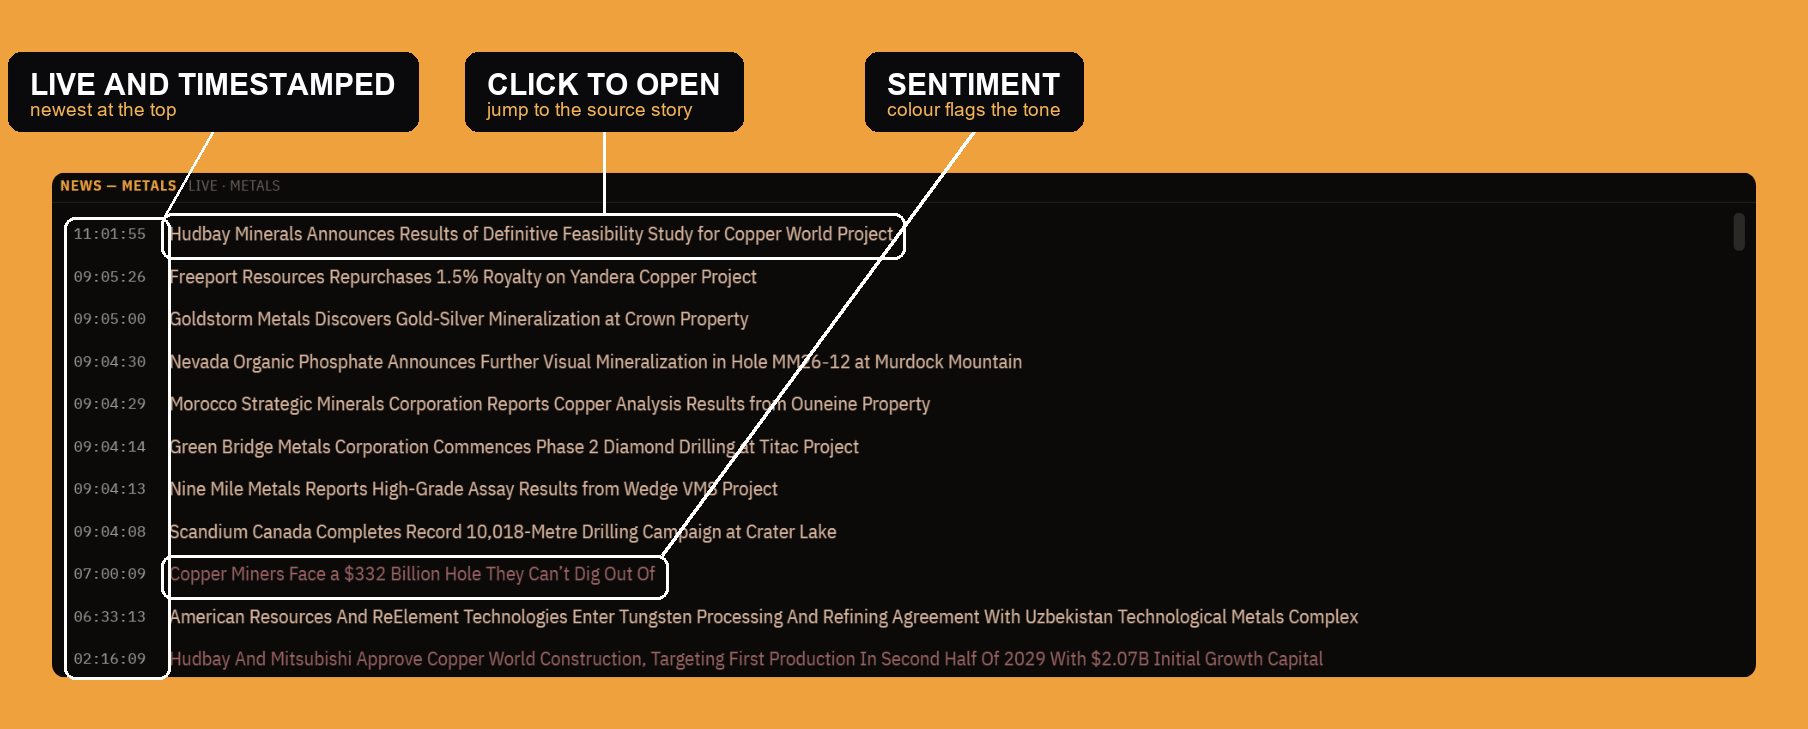
The bottom of the panel is a live headline tape filtered to metals and mining, newest at the top with its timestamp, so drill results, mine disruptions, central-bank gold buying, and deal news sit right next to the prices and fundamentals they move. Click a headline to open the source story, and a sentiment color flags the tone at a glance. It keeps the "why" next to the "what," the narrative running alongside the numbers above it.
Settings
Like the other research panels, Metals is configurable from the gear in the top-right (or by right-clicking the window), as a list with one section per piece of the panel.
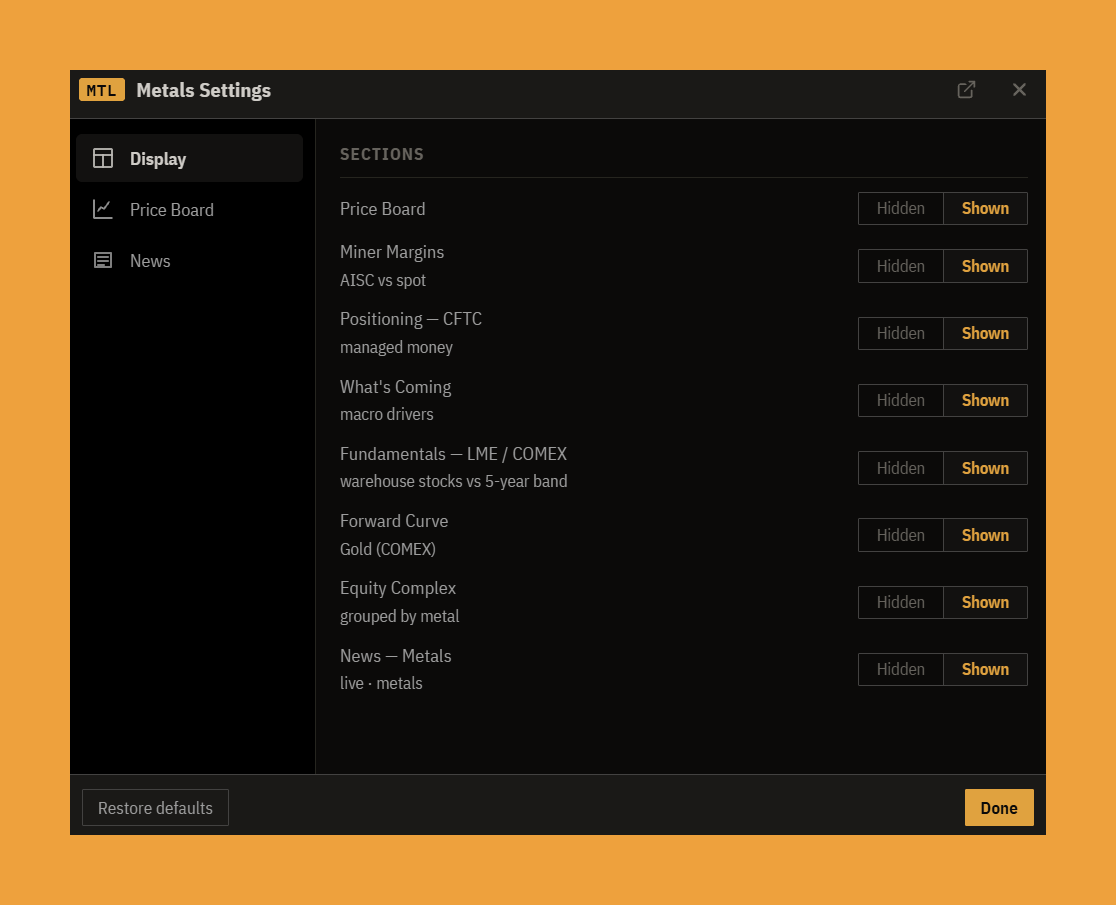
- Display is the show/hide list: turn any section (price board, miner margins, positioning, what's coming, fundamentals, forward curve, equity complex, news) on or off to keep only what you use.
- Price Board lets you add custom chart time-frames: type a number, pick a unit, and it adds a quick button next to the built-in 1D / 1W / 1M / 3M / 1Y.
- News tunes the tape: an importance filter sets the floor so you see only headlines at a chosen tier and up, and row-field toggles decide what each headline shows (the source, the time and date, the importance meter, and a sentiment stripe or chip), plus whether a headline opens its source on click.
The bottom line
The Metals panel is the whole complex in one window: the price board for spot, miner margins for what the metal is worth to the people digging it, the forward curve for carry and tightness, CFTC positioning for crowding, LME/COMEX stocks and the gold/silver ratio for the physical picture, the macro calendar for the dollar and real yields that drive it, the equity complex for which stocks it moves, and the news for why. Precious on one side, base on the other, read together instead of a dozen screens apart.