Research
NRGEnergy
The oil and gas desk on one screen: a crude-and-products price board, refining cracks, the WTI forward curve, CFTC positioning, EIA fundamentals, the release calendar, the equity complex, and a live energy tape.
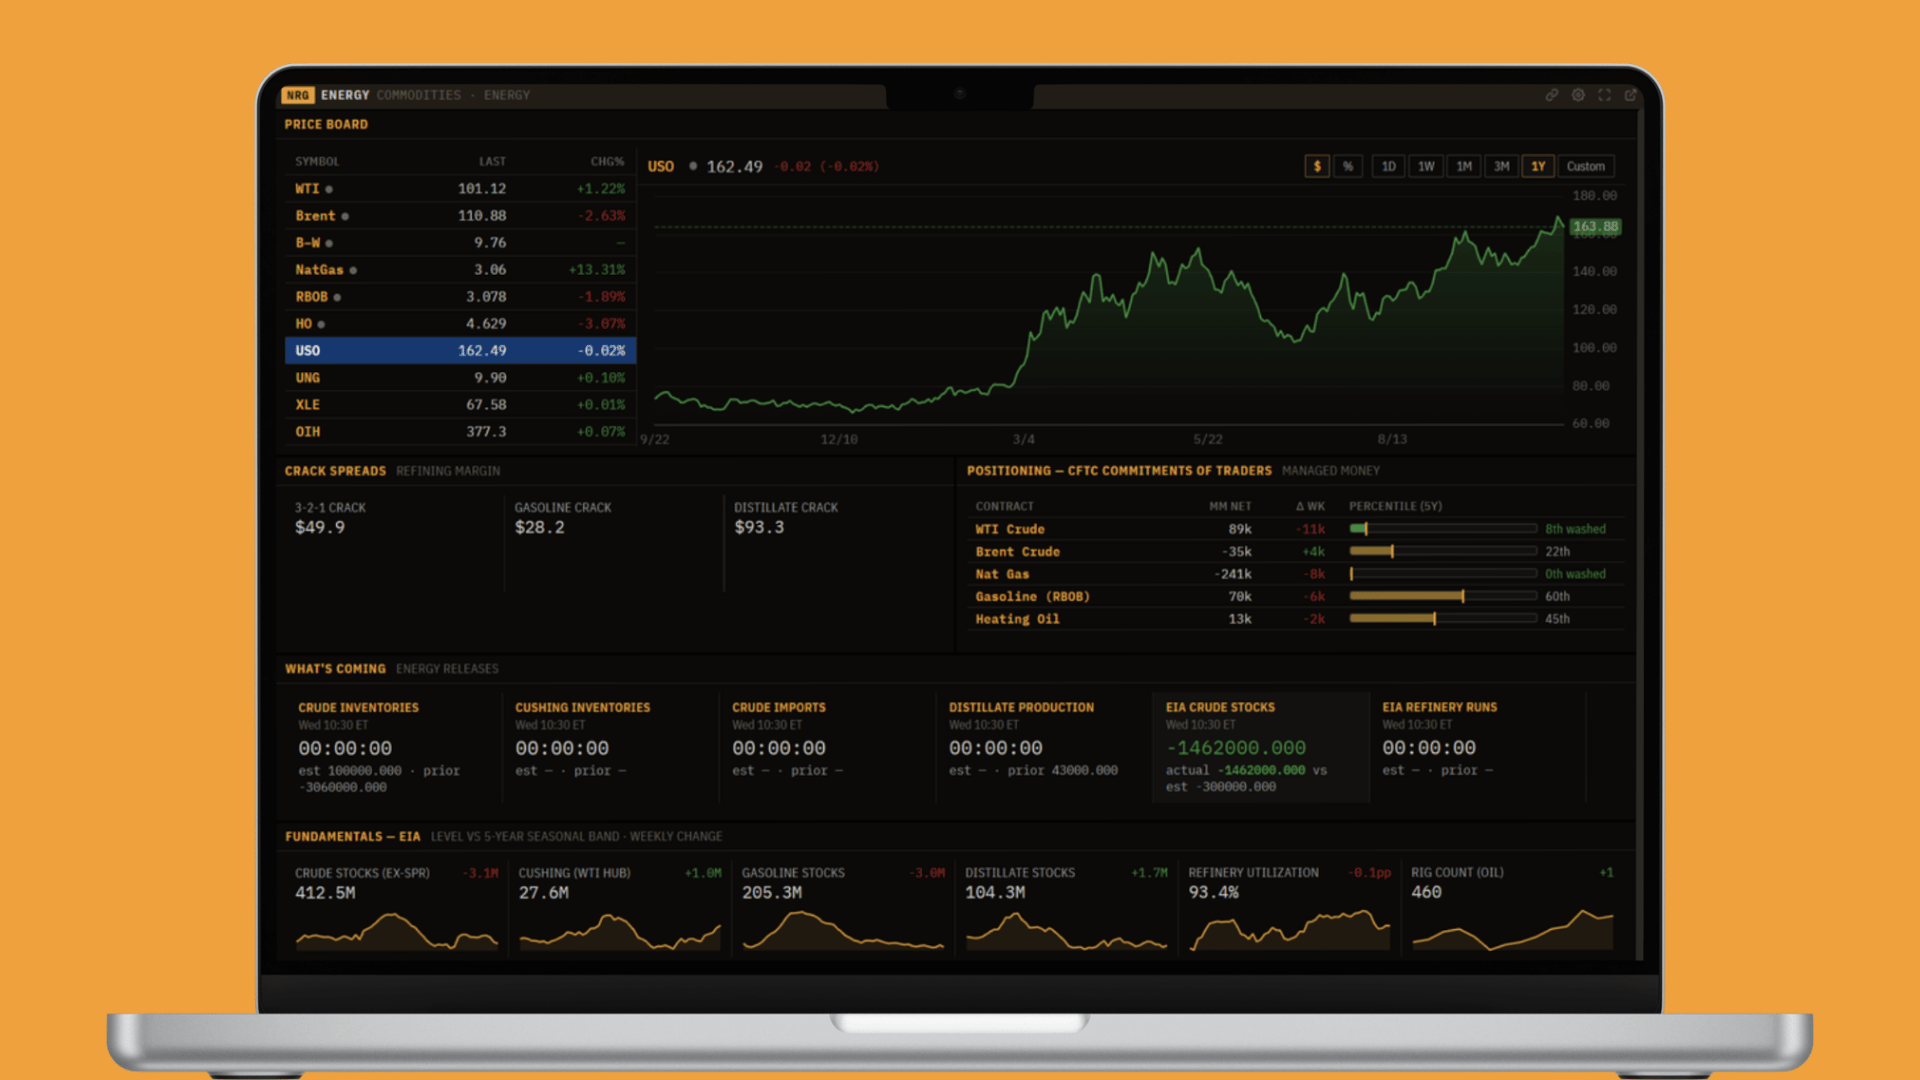
Energy is its own world. Crude, refined products, and natural gas trade on their own supply-and-demand clock, with a weekly data cycle, a futures curve that tells you about storage, a positioning report that tells you about crowding, and an equity complex that splits cleanly into winners and losers depending on which way the barrel moves. This panel is the oil and gas desk on one screen: spot prices, refining margins, the forward curve, who is positioned, what the fundamentals say, what prints next, and which stocks it moves.
Why this panel exists
An energy trader is reading several different markets at once, and they do not line up on a normal stock screen. Spot crude is one thing; the shape of the futures curve is another (and often the more important one); refining margins are a third; the weekly EIA inventory data is a fourth; and the CFTC positioning report is a fifth. Each lives in a different place and updates on its own schedule. This panel gathers them so the question becomes "what is the oil market telling me today?", the price, the curve, the margin, the fundamentals, the positioning, and the news, read together instead of hunted down one tab at a time.
Note: This is end-of-day and weekly data (prices, the curve, EIA, CFTC), not a tick-by-tick live feed. Read it as today's picture of the energy market.
The price board
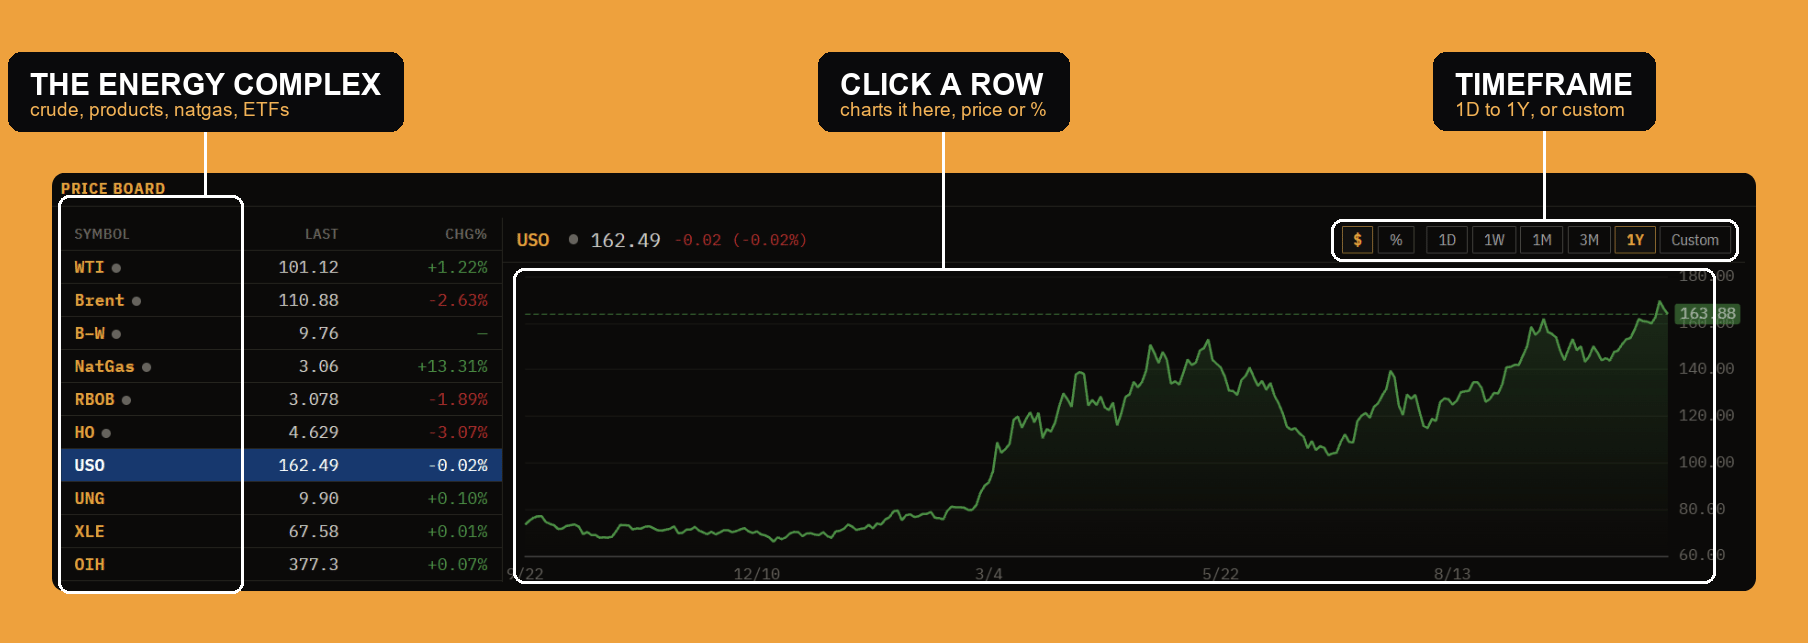
The board is the energy complex at a glance, top to bottom: WTI and Brent crude, the B-W (Brent minus WTI) spread, NatGas, RBOB gasoline, HO heating oil, and the tradeable ETFs (USO, UNG, XLE, OIH). Each row shows the last price and the day's percent change. Click any row and the chart on the right plots that instrument's history; the toggles switch between price and percent and the time window (1D through 1Y, or a custom range). It is the one place to see crude, products, gas, and the energy ETFs moving together.
Crack spreads
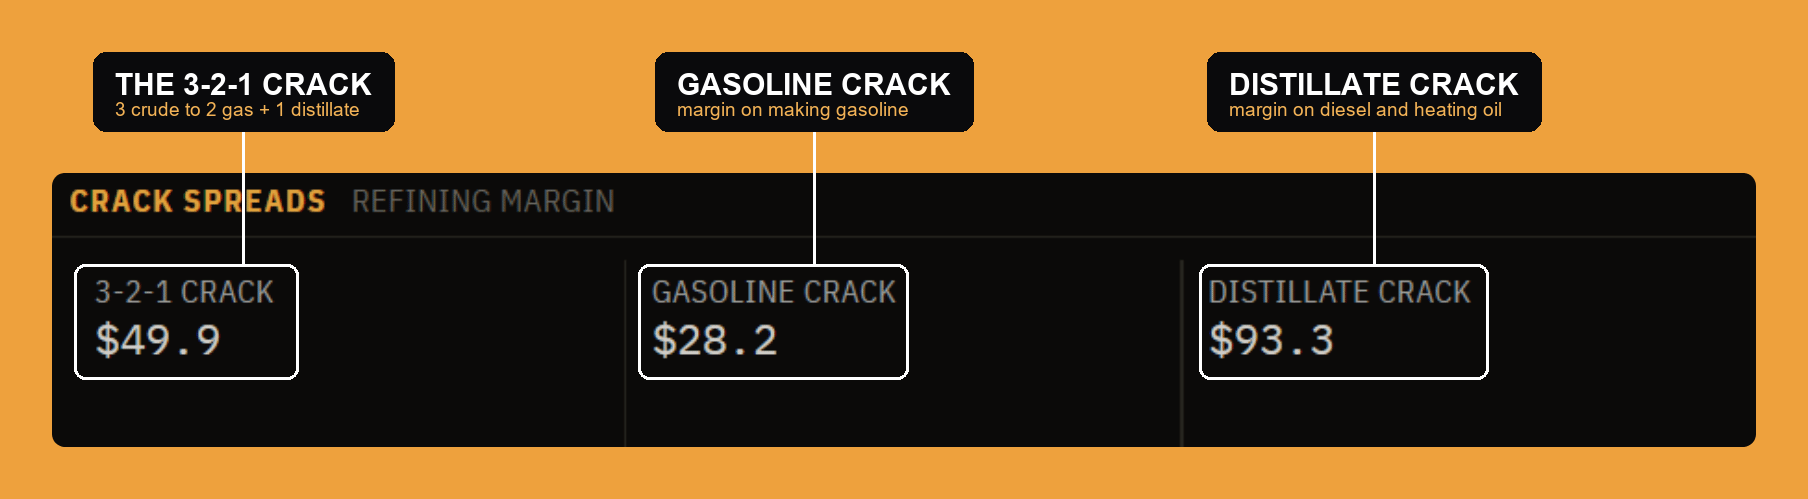
A crack spread is the refiner's margin, the gap between what crude costs and what the products it becomes sell for. The headline is the 3-2-1 crack: the margin from turning 3 barrels of crude into 2 of gasoline and 1 of distillate, the standard proxy for refinery profitability. The gasoline crack and distillate crack split that into the two products. Wide cracks mean refiners are making money and will run hard (bullish for crude demand, bearish for product prices); narrow cracks mean the opposite. It is the number that connects the crude market to the pump.
The forward curve
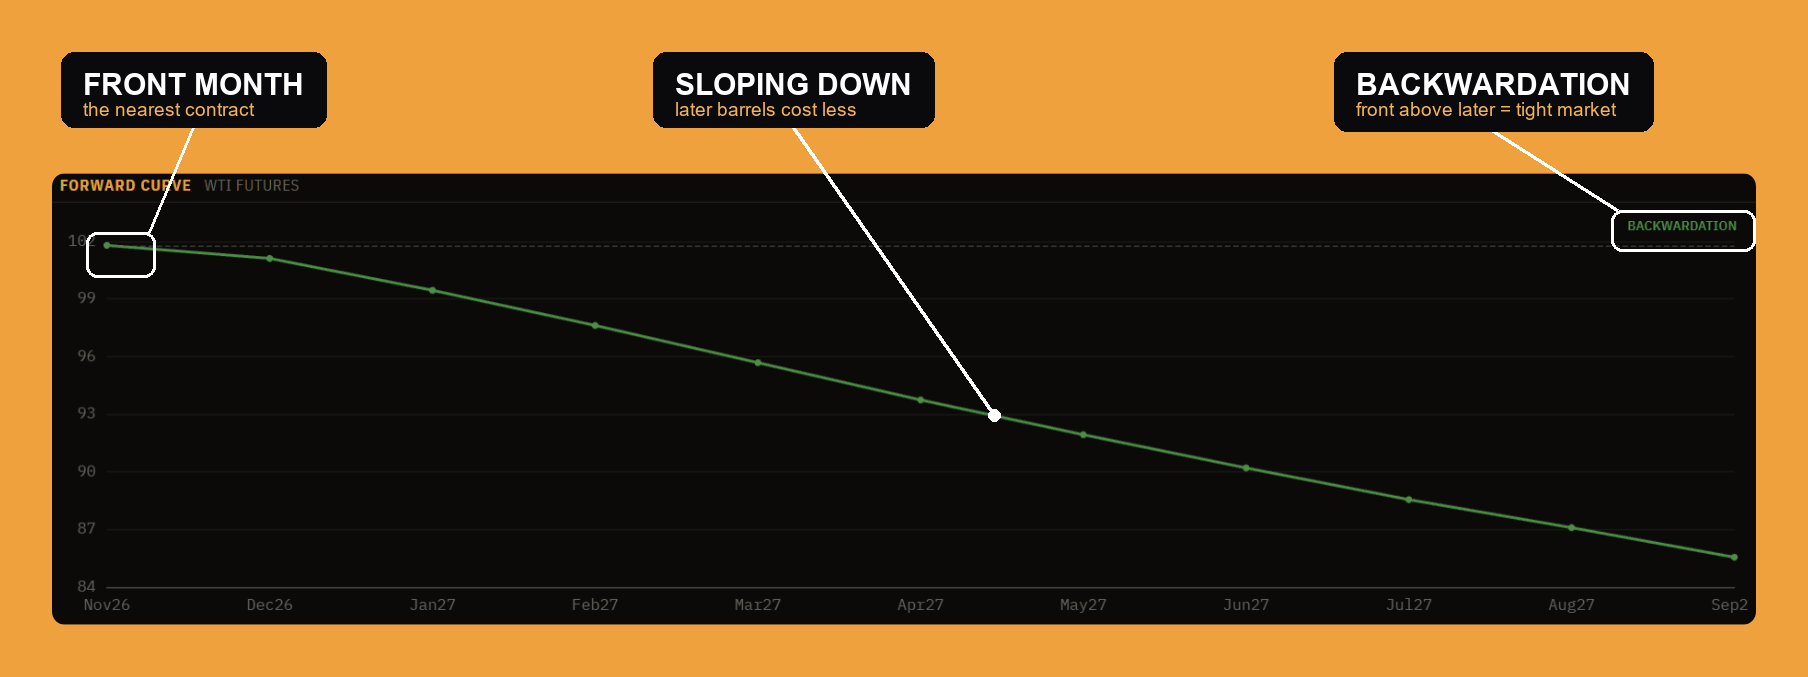
The forward curve plots WTI futures by delivery month, and its slope is a supply signal. When the near months are priced above the later ones, the curve is in backwardation (the panel labels it), which says the market will pay up for a barrel now, the sign of tight prompt supply. The opposite shape, later months above the front, is contango, which says there is plenty around and it pays to store it. The front point is the nearest contract; the slope from there is often a better read on the physical market than the spot price itself.
CFTC positioning
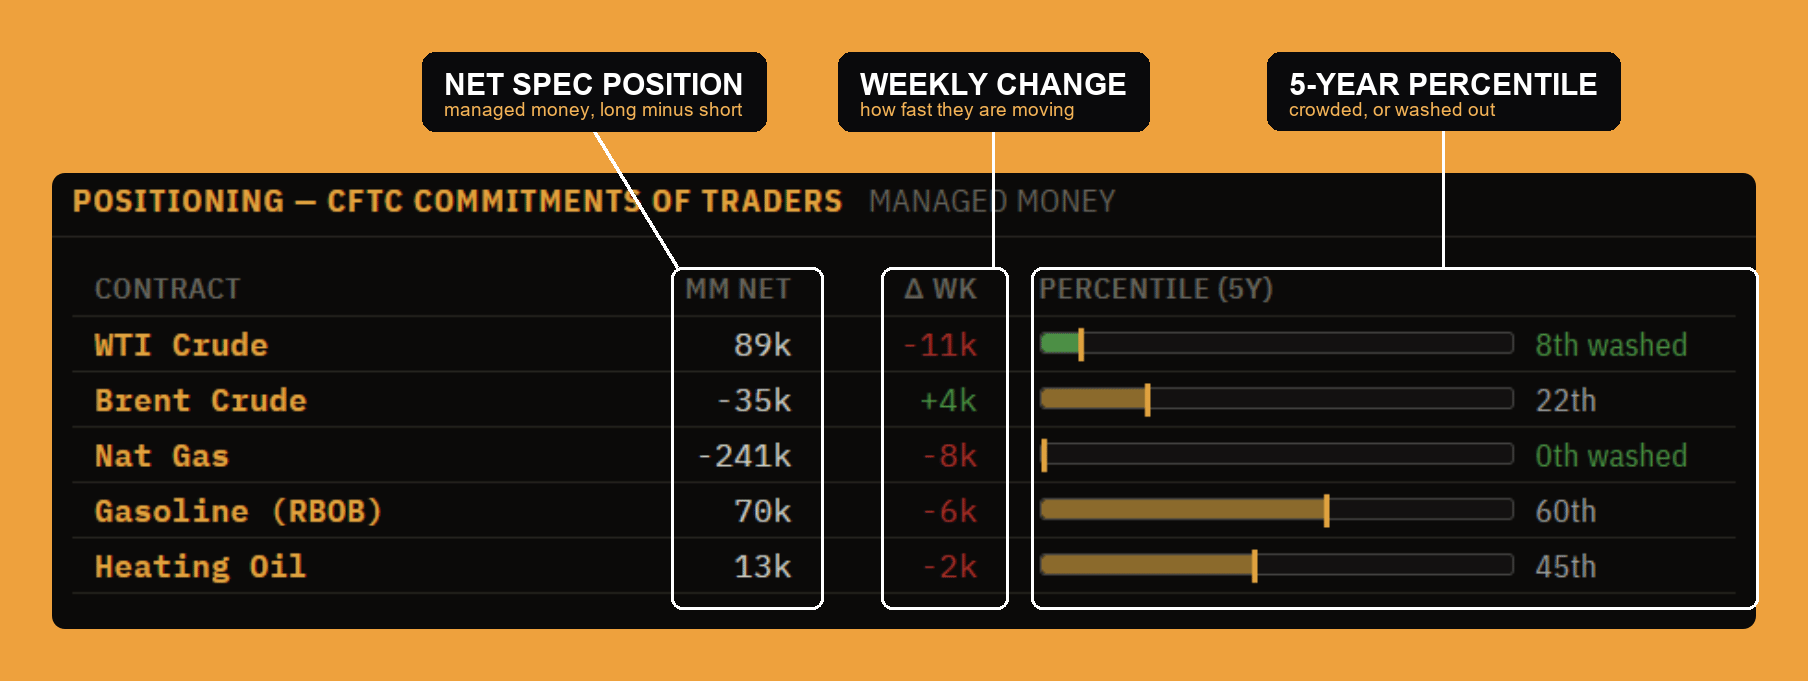
The Commitments of Traders report shows how the big speculators are positioned. This block reads the managed money category (the trend-following funds) for each contract: the net position (long minus short), the weekly change (how fast they are adding or cutting), and a five-year percentile that says whether the position is crowded or washed out. Positioning is a contrarian tell at the extremes: a market everyone is already long has no one left to buy, and a "washed out" reading (near the bottom of its range) is often where the next move starts.
EIA fundamentals
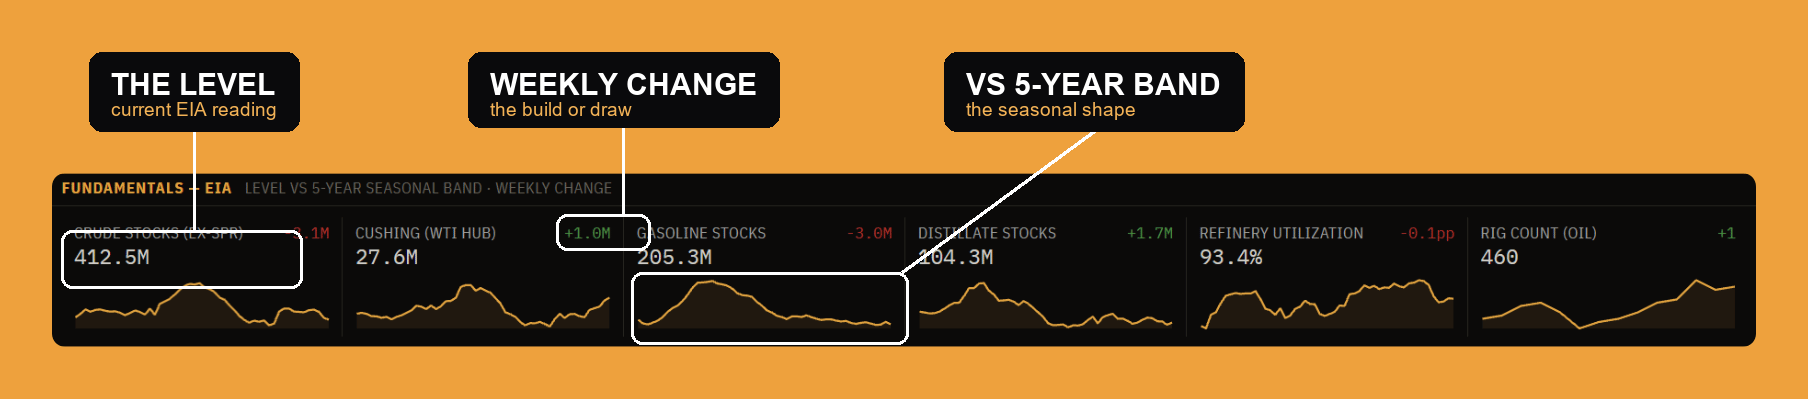
This is the weekly EIA supply picture, the data the whole market trades around every Wednesday: crude stocks (ex-SPR), Cushing (the WTI delivery hub), gasoline and distillate stocks, refinery utilization, and the oil rig count. Each shows the current level and the weekly change, the build or draw that moves the price on release. The sparkline sets it in context: where today's level sits against the 5-year seasonal band, so a draw that looks big is judged against what is normal for the time of year.
What's coming
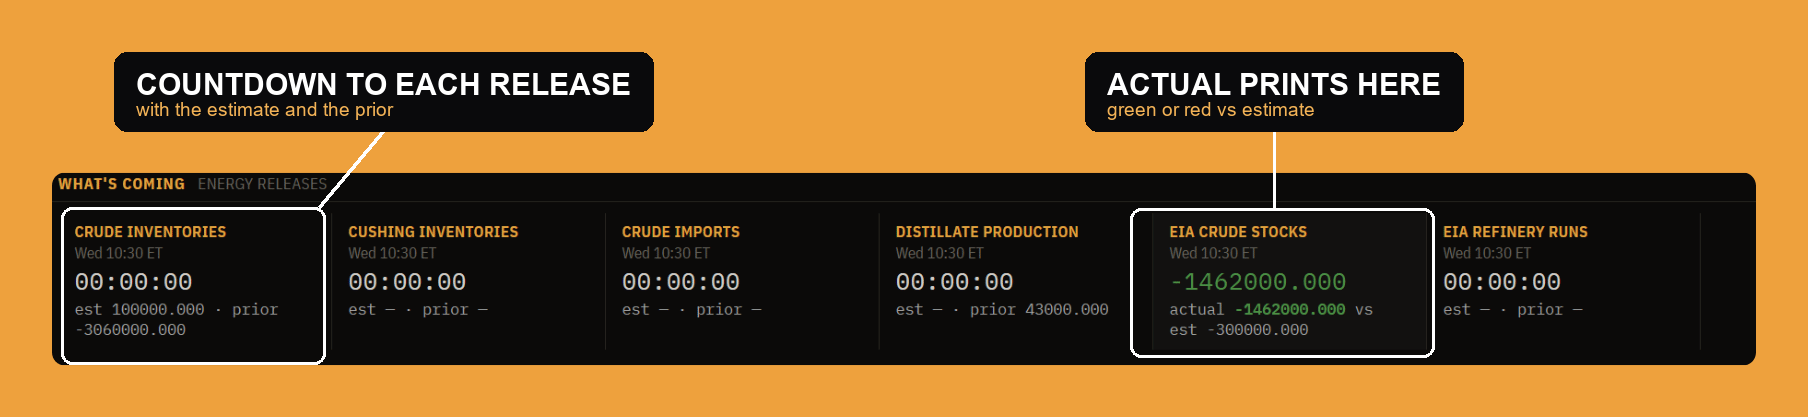
The release calendar counts down to the next prints, crude inventories, Cushing, imports, distillate production, EIA crude stocks, refinery runs, each with its scheduled time, the estimate, and the prior value. When a number releases, the actual fills in, colored green or red against the estimate, so you see the surprise the moment it lands. It is the "what to watch for" that sits next to the fundamentals above it: the schedule, the expectation, and then the result.
The equity complex
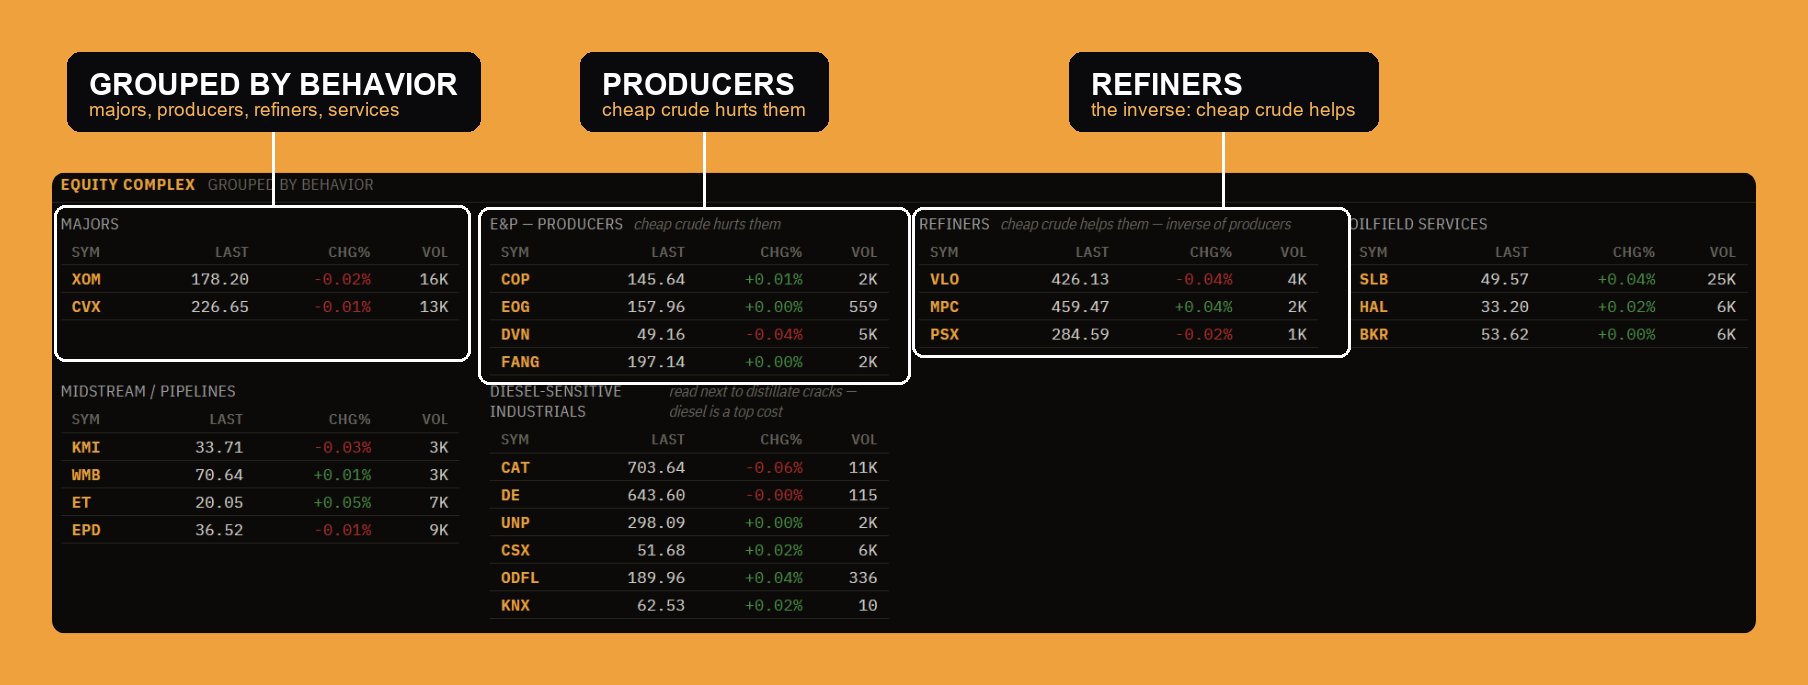
A move in crude does not hit every energy stock the same way, so the equity complex is grouped by behavior. Majors (XOM, CVX) and E&P producers (COP, EOG, DVN, FANG) rise and fall with crude, cheap crude hurts them. Refiners (VLO, MPC, PSX) are the inverse: cheap crude is their raw material, so it helps them. Oilfield services (SLB, HAL, BKR) track drilling activity, midstream and pipelines (KMI, WMB, ET, EPD) earn on volume more than price, and diesel-sensitive industrials (the railroads and truckers) are read next to the distillate crack, because diesel is a top cost for them. Grouping the names this way turns a crude move into a clear "who benefits, who gets hurt."
Energy news
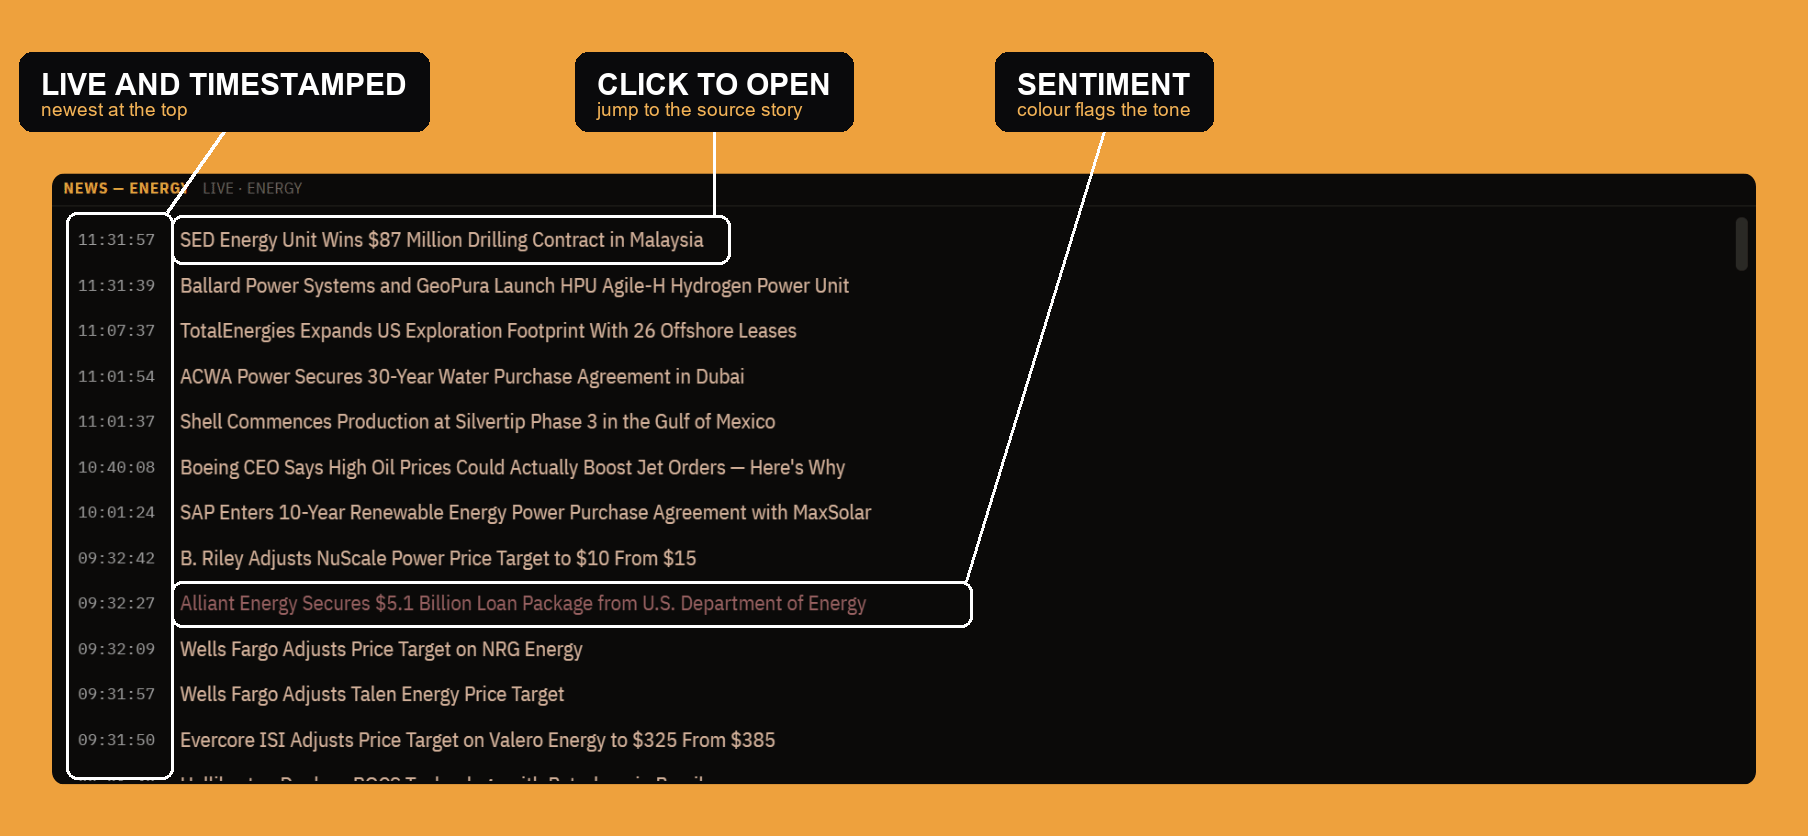
The bottom of the panel is a live headline tape filtered to energy, newest at the top with its timestamp, so OPEC headlines, pipeline outages, inventory surprises, and company news sit right next to the prices and fundamentals they move. Click a headline to open the source story, and a sentiment color flags the tone at a glance. It keeps the "why" next to the "what," the narrative running alongside the numbers above it.
Settings
Like the other research panels, Energy is configurable from the gear in the top-right (or by right-clicking the window). The settings open as a list, one section per piece of the panel.
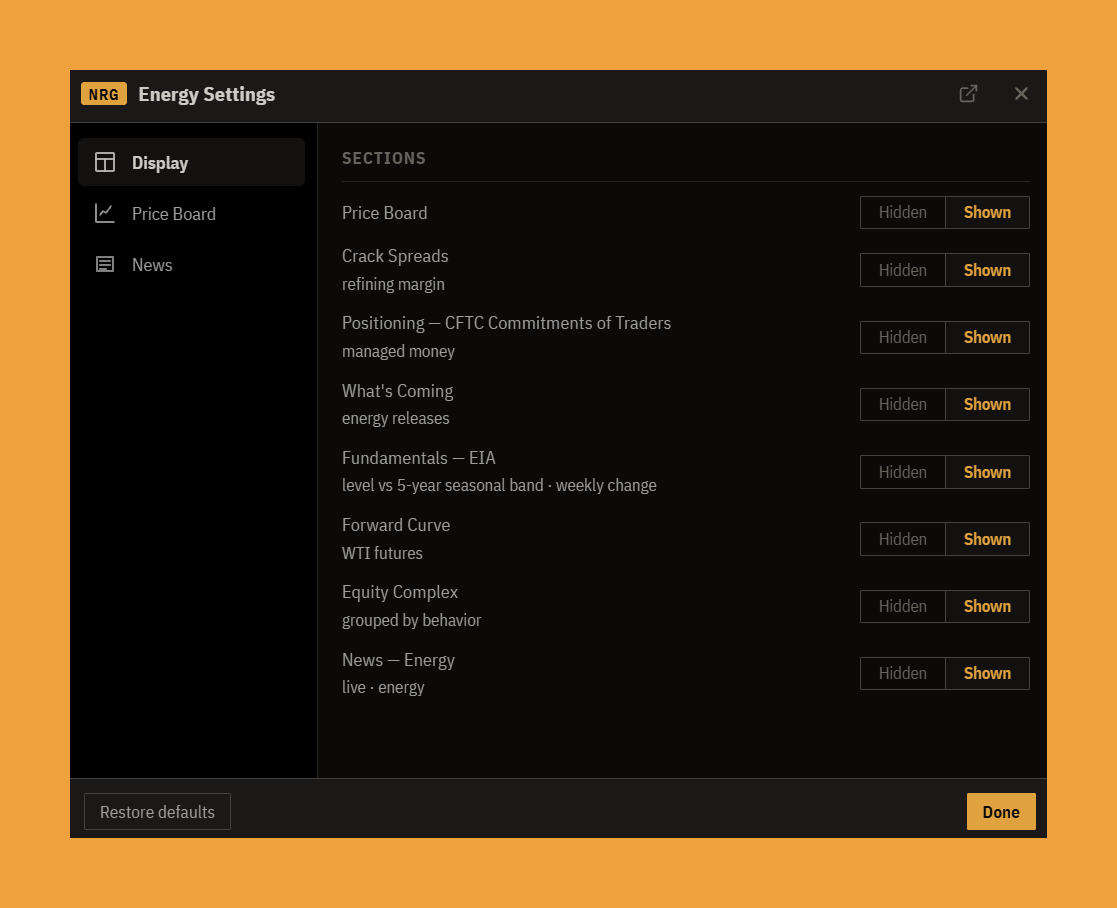
- Display is the show/hide list: turn any section (price board, crack spreads, positioning, what's coming, fundamentals, forward curve, equity complex, news) on or off to strip the panel down to what you use.
- Price Board lets you add custom chart time-frames: type a number, pick a unit, and it adds a quick button next to the built-in 1D / 1W / 1M / 3M / 1Y, so a window you check often is one click away.
- News tunes the tape: an importance filter sets the floor so you see only headlines at a chosen tier and up, and a set of row-field toggles decides what each headline shows (the source, the time and date, the importance meter, and a sentiment stripe or chip), plus whether clicking a headline opens its source.
The bottom line
The Energy panel is the oil and gas desk in one window: the price board for spot, the forward curve for what storage is saying, the crack spreads for refining margins, CFTC positioning for crowding, the EIA fundamentals and release calendar for supply, the equity complex for which stocks it moves, and the news tape for why. Read them together and a day in energy stops being six separate screens and becomes one picture.